Our work/Your monthly report, built for your store
The report you receive every month.
Built from the exports and reports of each marketplace, read with you on a call, and ending in the decisions for next month: sales by channel, net profit after every cost, where the money from each sale goes, buyers and return on ad spend, month by month.
The exports and reports of each marketplace, collected every month
Profit after every fee, ad cost and voucher, per store
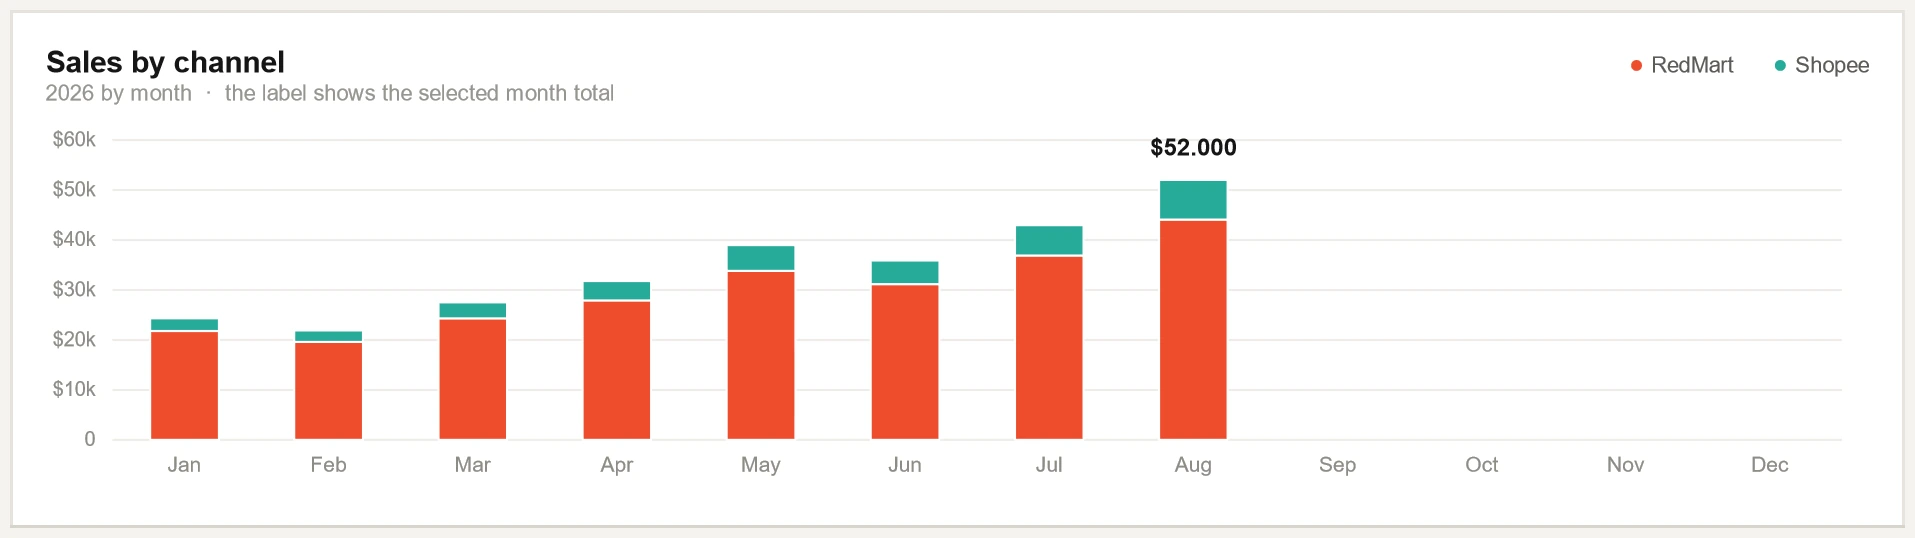
Sales by channel, cost structure, buyers and return on ad spend, month by month
A call with the report on screen that ends in the decisions for next month
First the whole page and how a month gets onto it. Then each part on its own: what it shows, the data behind it, how to read it and what the store owner gets from it. Last, the rest of the workbook.
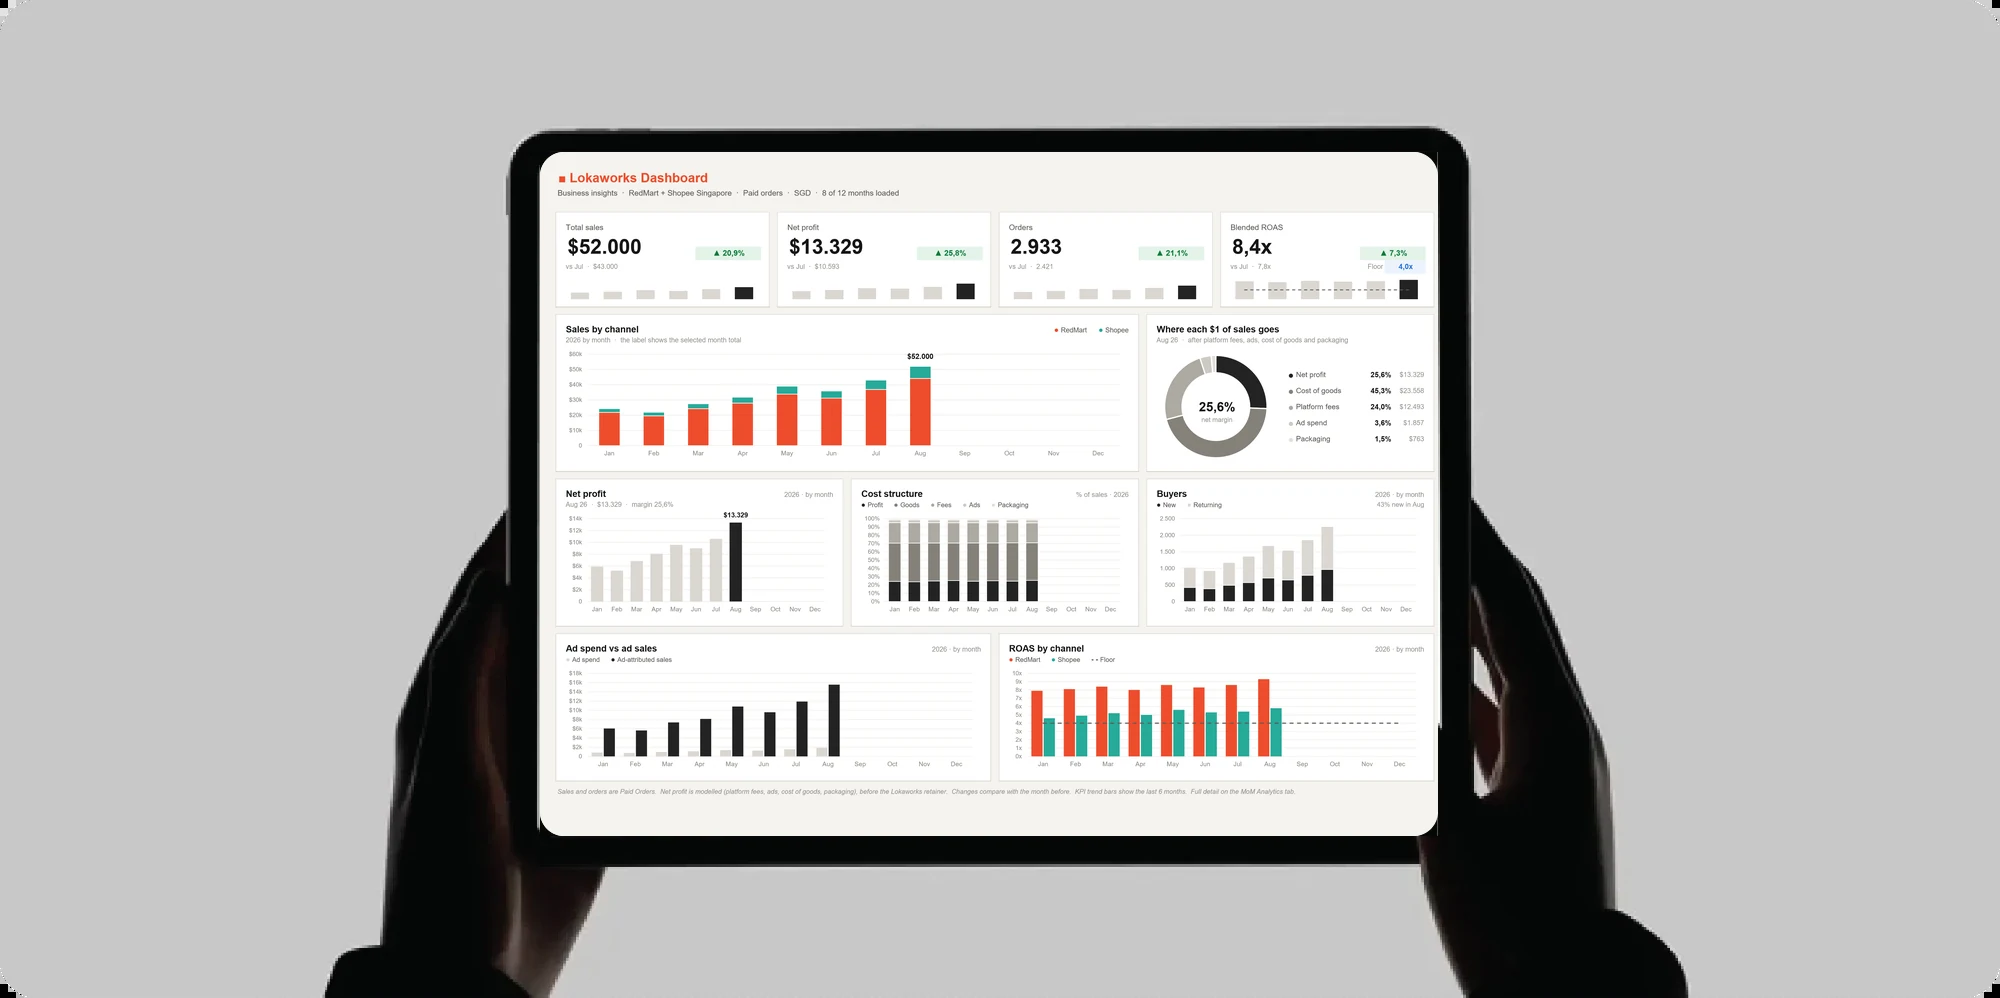
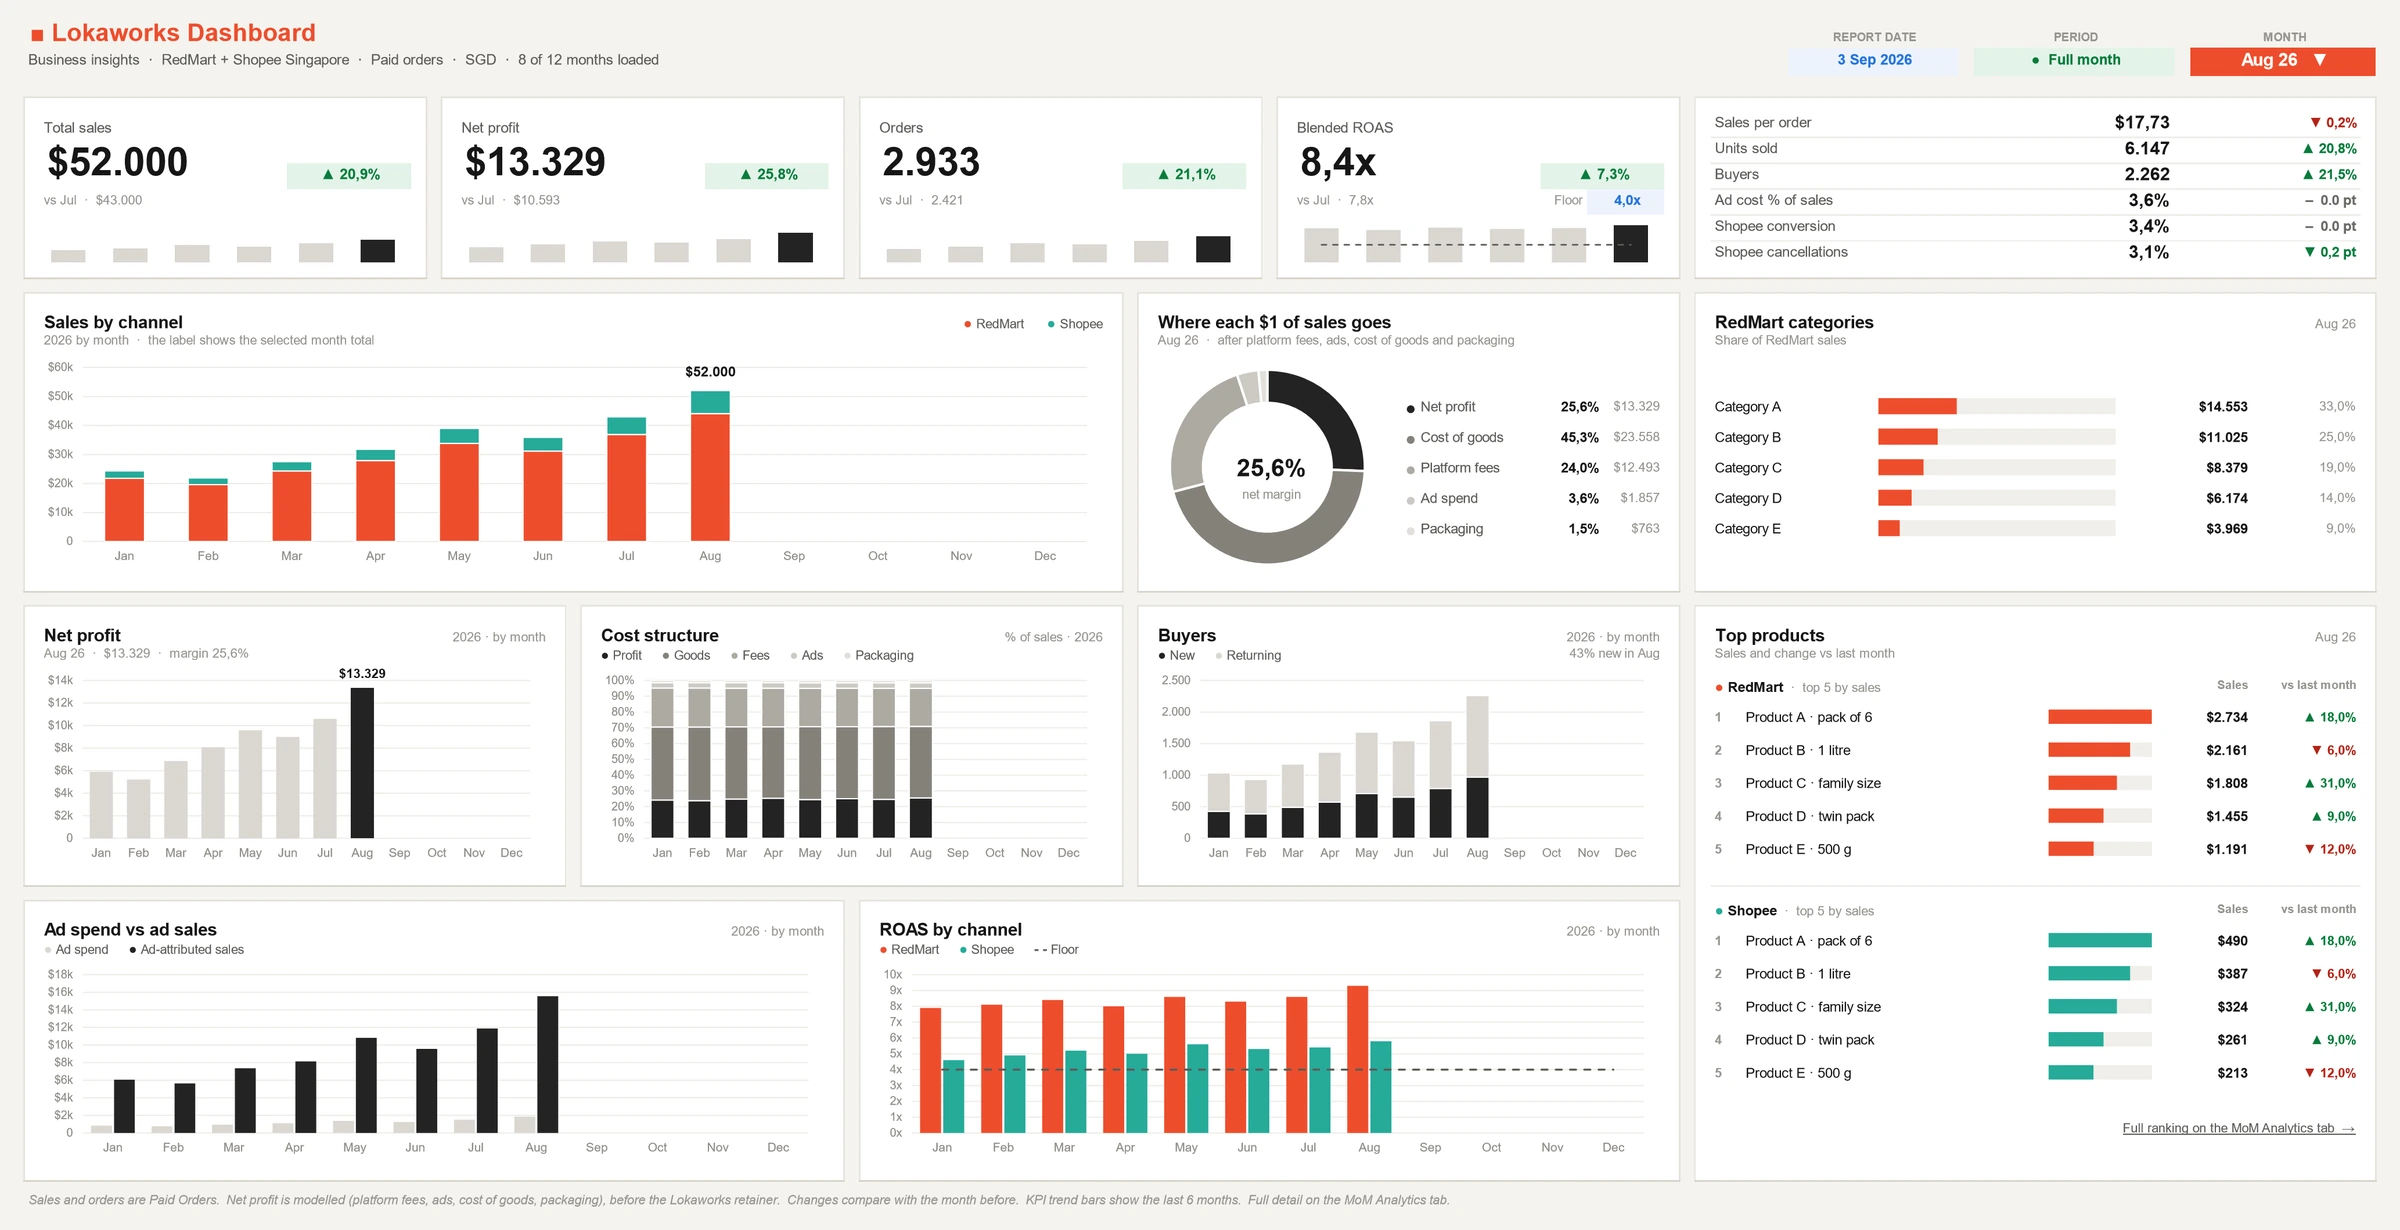
The whole dashboard on one screen. The 13 parts below are cut from this picture.
How it works
1
The month is collected
Every month the exports and reports of each marketplace are collected: orders, the fees charged, ads and buyers, and for Shopee the traffic page.
2
The figures are entered once
The figures of the month are entered once, one column a month. Product costs come from you: what each pack costs you.
3
The workbook works out the rest
Everything else is a formula, and net profit is a model: platform fees, cost of goods and packaging are modelled lines. The workbook checks its own totals.
4
The month box changes the whole page
Choose a month in the box at the top right, and every figure, change and marked bar reads that month.
5
It is read with you on a call
The report is on screen, and the call ends in the decisions for next month.
Scroll sideways to see all of it, or open the picture.
What it shows
The channels the report covers, that it counts paid orders, the currency and how many months are loaded. At the right: the report date, the period and the month.
The data behind it
The exports and reports of each marketplace: orders, the fees charged, ads and buyers, collected every month. Here the channels are RedMart and Shopee Singapore.
How it works
The month box chooses the month, and every figure, change and marked bar on the page follows it. The period box says whether that month is a full month. The line under the title counts the months loaded: 8 of 12 here.
What the store owner gets
You know which channels, which month and which currency a figure belongs to, and whether the month is complete, before you act on it.
Scroll sideways to see all of it, or open the picture.
What it shows
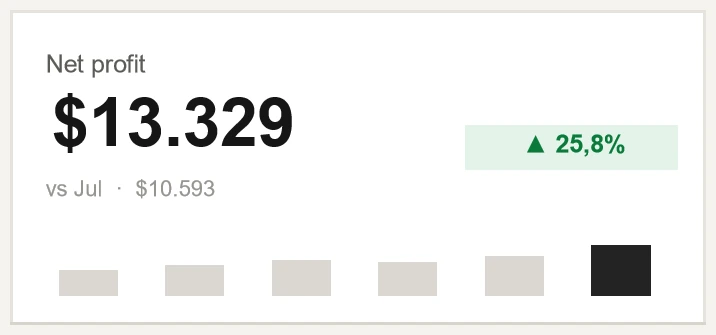
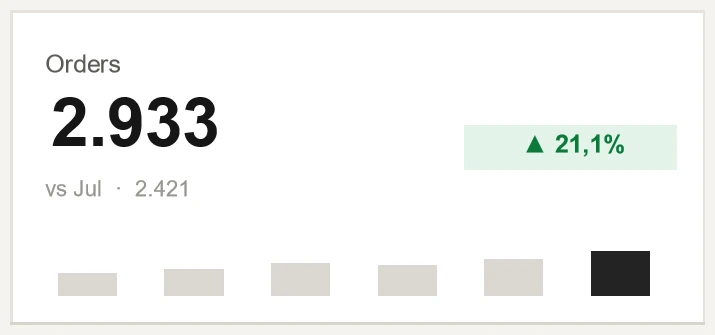
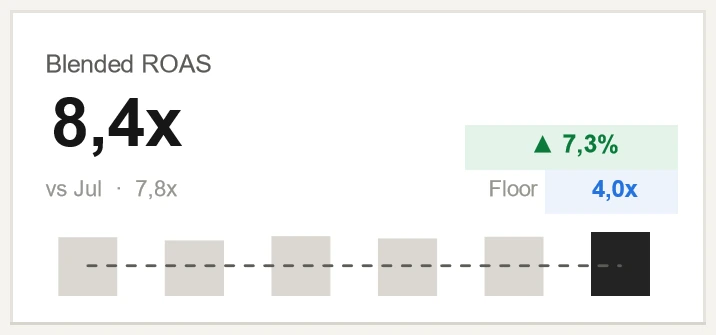
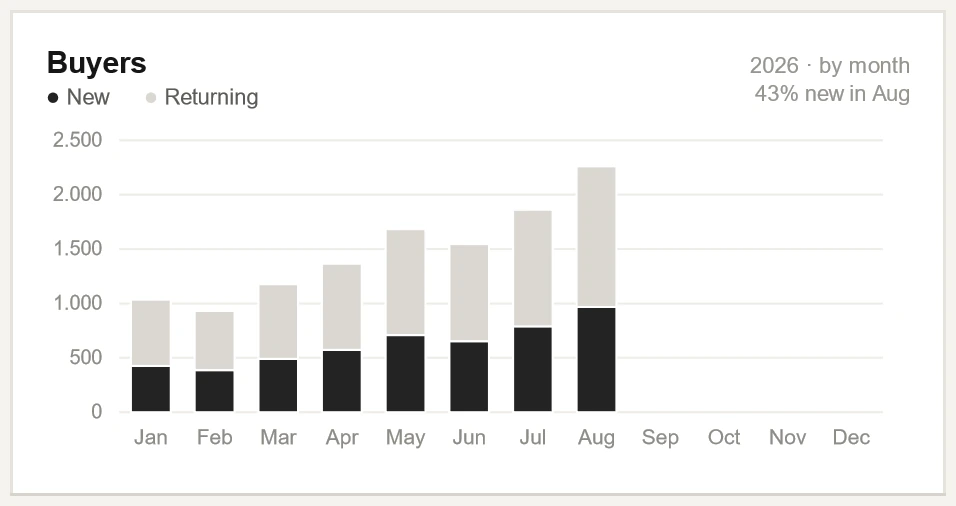
Total sales, Net profit, Orders and Return on ad spend, all channels, for the month. Return on ad spend is ad sales for each dollar of ad spend, all channels together.
The data behind it
Sales and orders count the paid orders in the reports of each channel, added up. Net profit is a model, before our own fee: sales less ad spend, both as the marketplaces report them, and less platform fees, cost of goods and packaging, all three modelled.
How to read it
The tag beside a figure is its change against the month before. The six small bars are the last six months, the dark one the month shown. The dashed line on the return on ad spend is the floor.
What the store owner gets
The month in four numbers, each with its direction: you know at once whether it needs a closer look.
Scroll sideways to see all of it, or open the picture.
What it shows
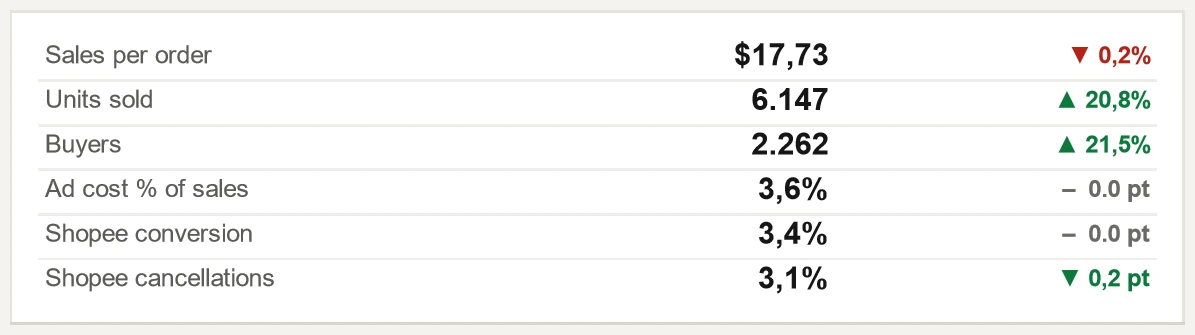
Six more figures of the month, each with its change against the month before.
The data behind it
Sales per order: sales divided by orders. Ad cost % of sales: all ad cost out of all sales. Shopee conversion: orders placed for each visitor. Shopee cancellations: cancelled orders out of orders placed.
How to read it
The change of a rate is in points, written pt. A dash is a change too small to show. Green is a change for the better: here the fall in cancellations.
What the store owner gets
You see what moved the main figures: more orders, larger orders or more buyers.
Scroll sideways to see all of it, or open the picture.
What it shows
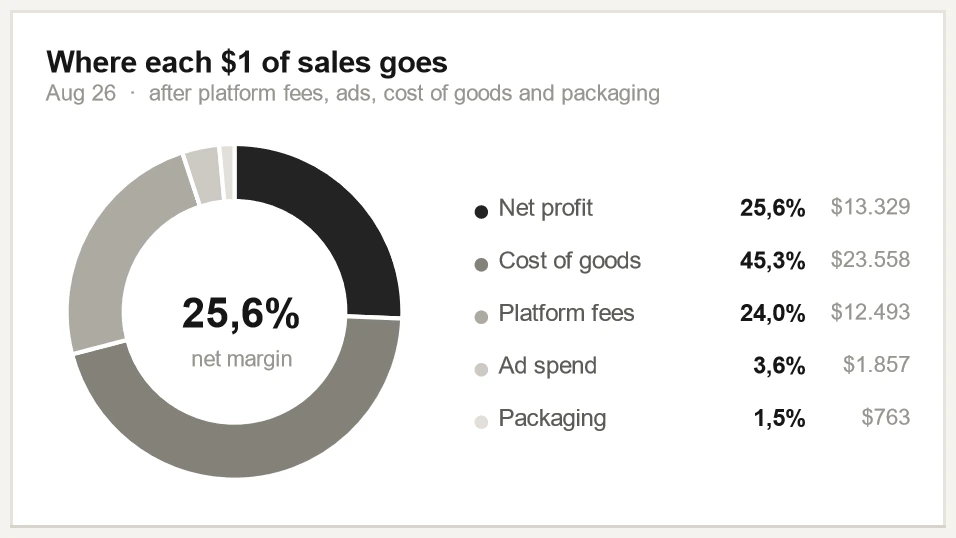
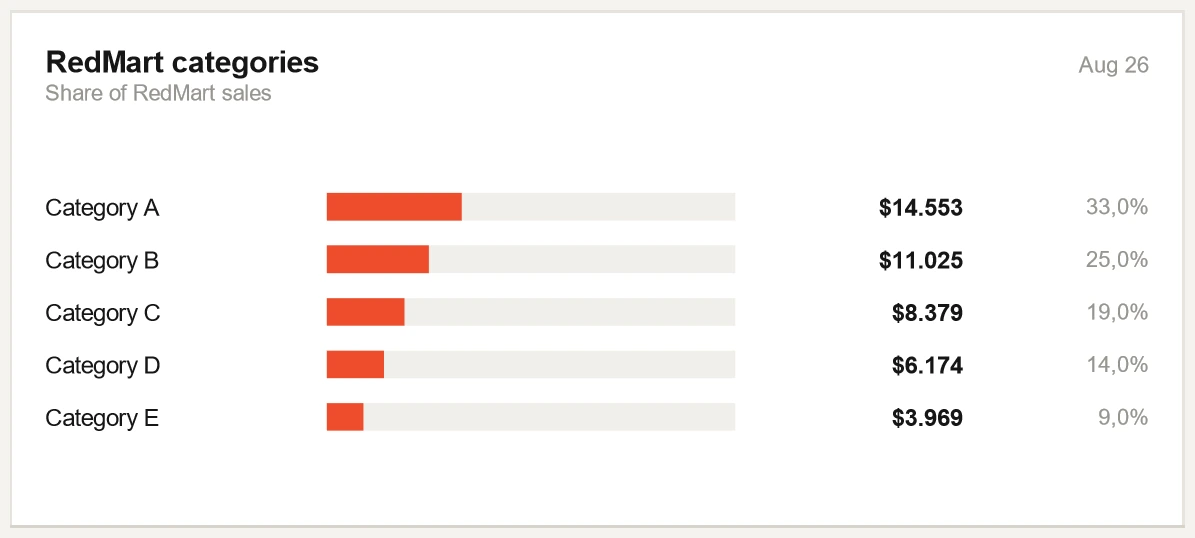
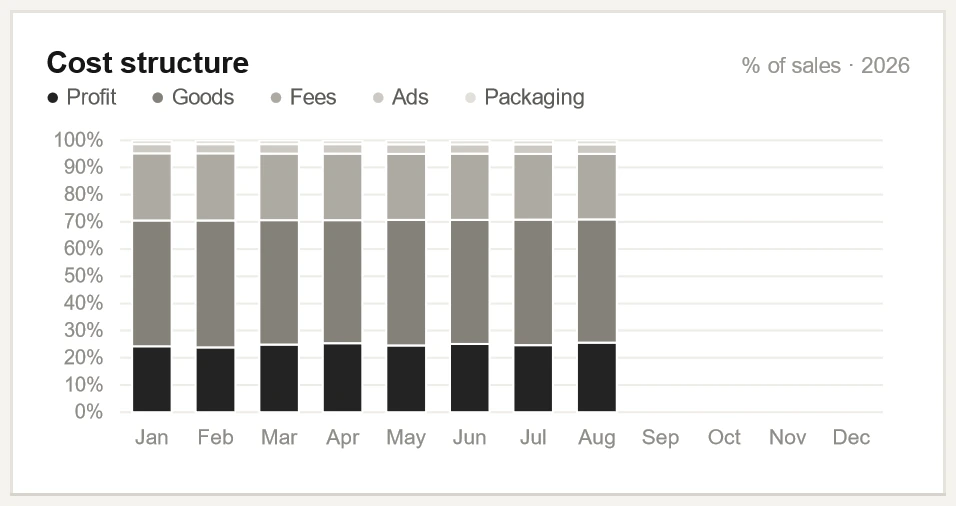
The sales of the month split five ways, each as a share and as an amount.
The data behind it
Ad spend is what the marketplaces report. The other three costs are modelled: platform fees from the fees each marketplace charges, cost of goods from your cost of each pack and the units sold, packaging as a packing cost for each order you pack yourself.
How to read it
The figure inside the ring is the net margin: net profit out of sales. Here it is 25.6%.
What the store owner gets
You see what is left of the money from each sale, and which cost takes most of the rest.
Scroll sideways to see all of it, or open the picture.
What it shows
Net profit for each month of the year. The dark bar is the month shown, and the line under the title gives its amount and its margin.
The data behind it
The same model as the Net profit figure, with its three modelled lines, worked out channel by channel and added up. The margin is net profit out of sales.
What the store owner gets
You see how profit has moved through the year, and whether the month shown is a high or a low one.
Scroll sideways to see all of it, or open the picture.
What it shows
The definitions the page rests on, in one line on the dashboard. Here the line is set in two so that it can be read.
How to read it
Sales and orders count paid orders. Net profit is modelled, before our own fee. Every change compares with the month before. The small bars are the last six months. The full detail is on the analytics tab.
What the store owner gets
Nobody has to ask what a figure includes: it is written on the page.
The analytics tab: every month of the year
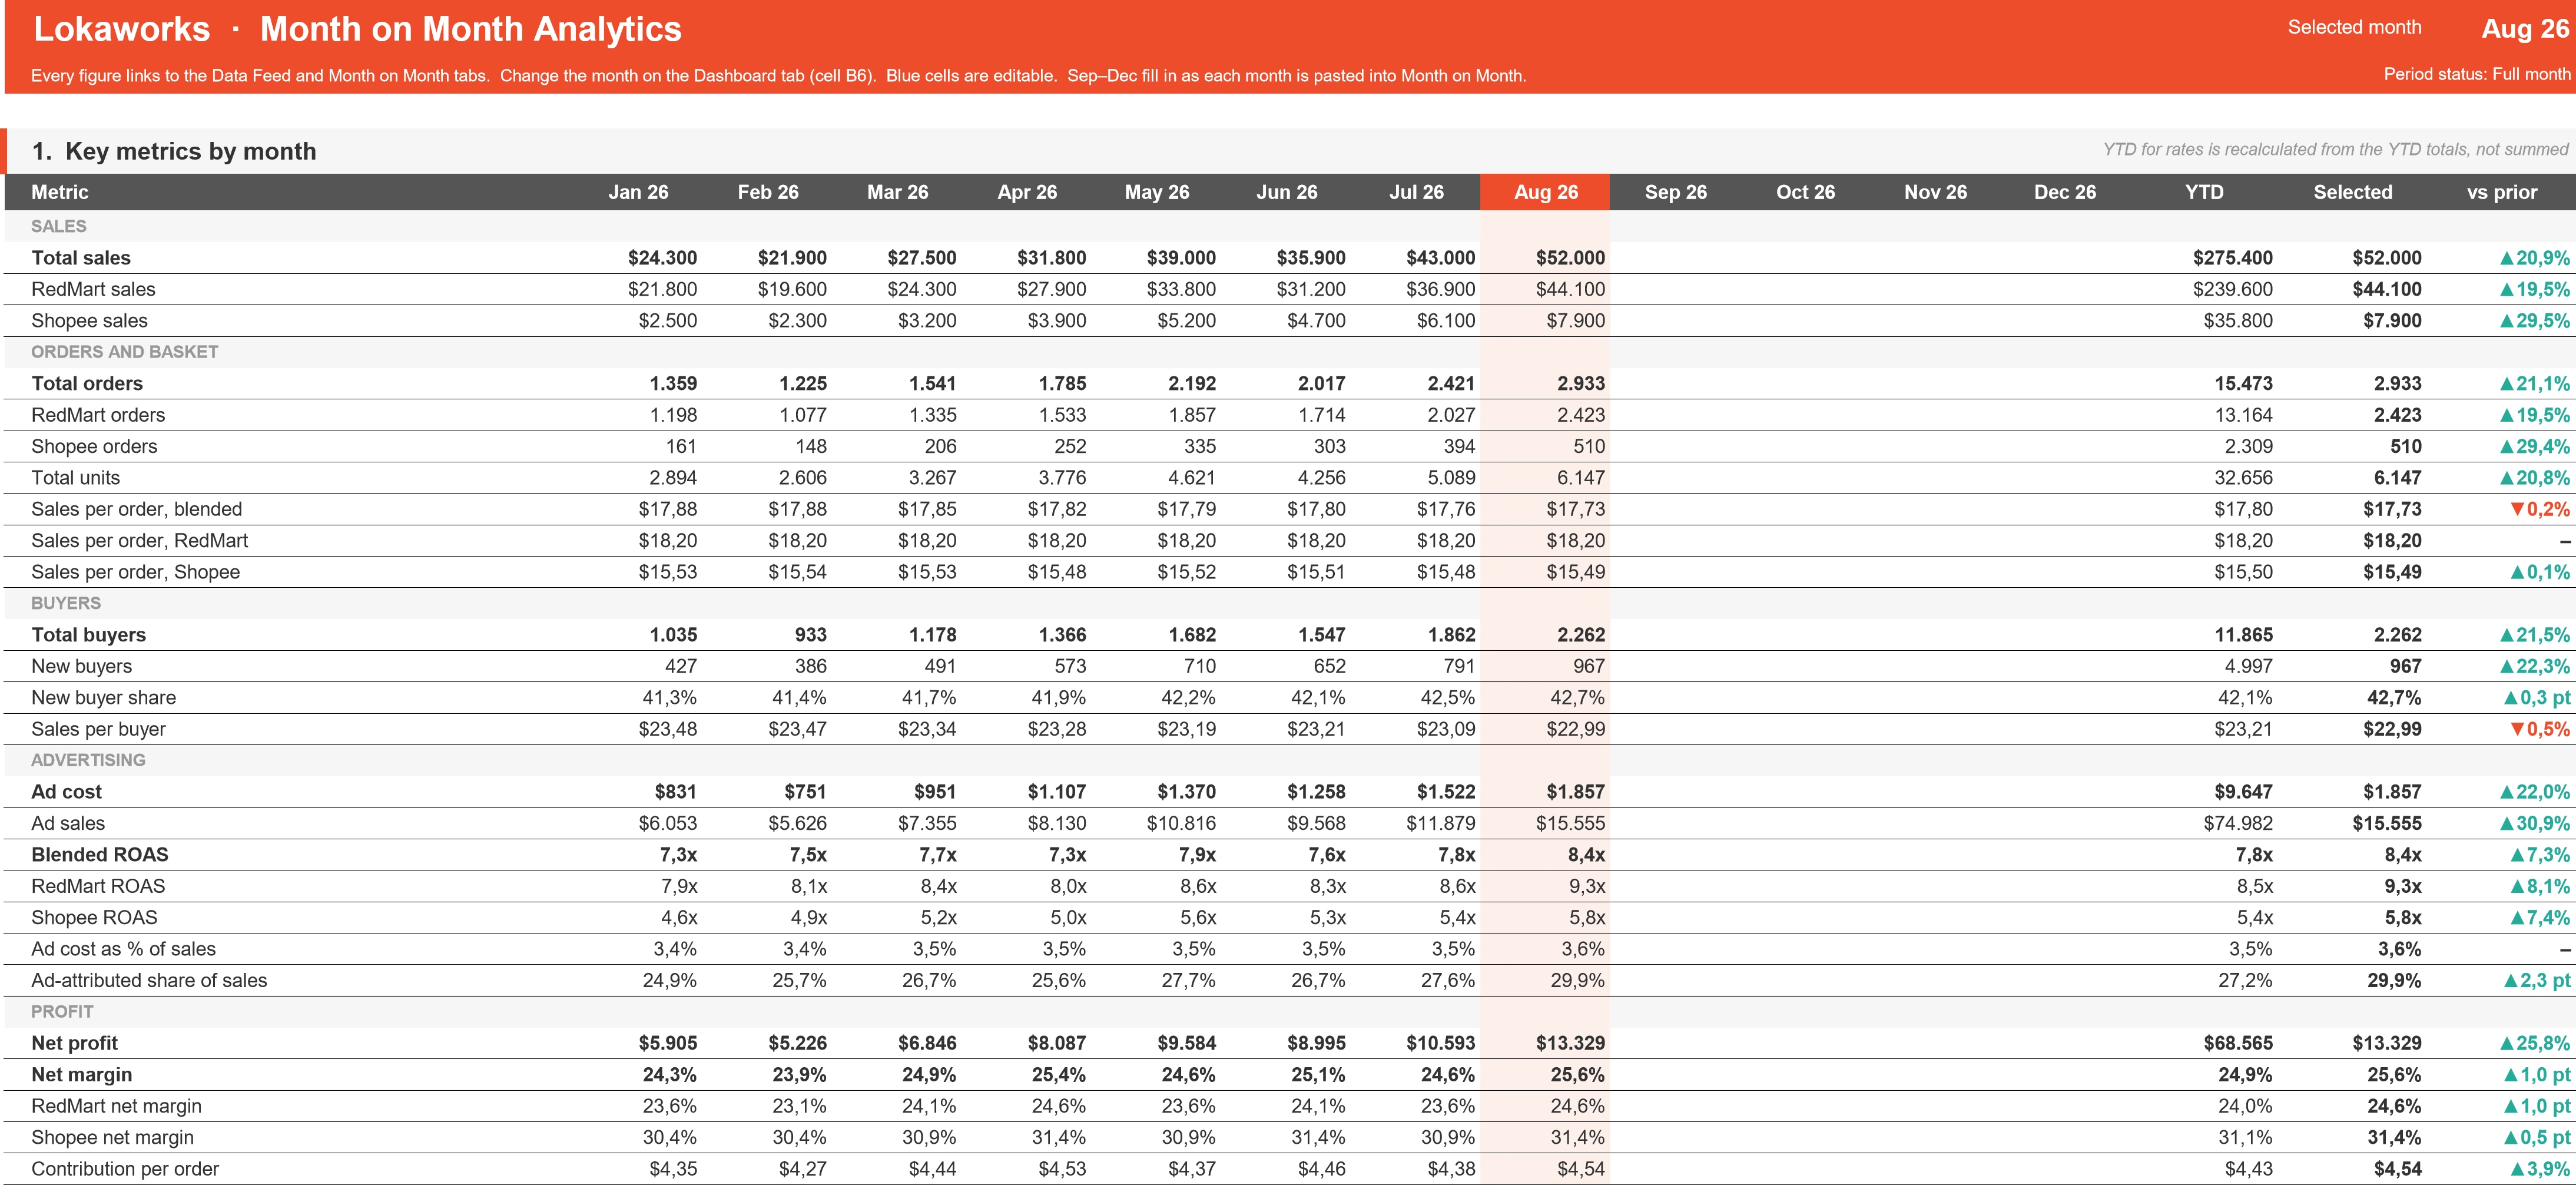
The tab behind the dashboard. Where the dashboard shows one month, this tab keeps every metric for every month of the year, with the year to date, the selected month and its change against the month before. It follows the month chosen on the dashboard.
The same store as on the dashboard above, so the figures agree.
Scroll sideways to see all of it, or open the picture.
What it shows
Under the head of the tab, the key figures of every month in five groups: sales, orders and basket, buyers, advertising and profit. Three columns close the table: the year to date, the selected month and its change against the month before.
The data behind it
The same sources as the dashboard. The table adds what the dashboard has no room for: sales, orders and margin for each channel, sales per buyer, the share of sales the ads account for, and contribution per order, which is net profit divided by orders.
How to read it
The shaded column is the selected month. In the year to date an amount is added up, while a rate is worked out again from the totals of the year, not averaged.
What the store owner gets
You can follow any figure of the dashboard back through the year, month by month.
Scroll sideways to see all of it, or open the picture.
What it shows
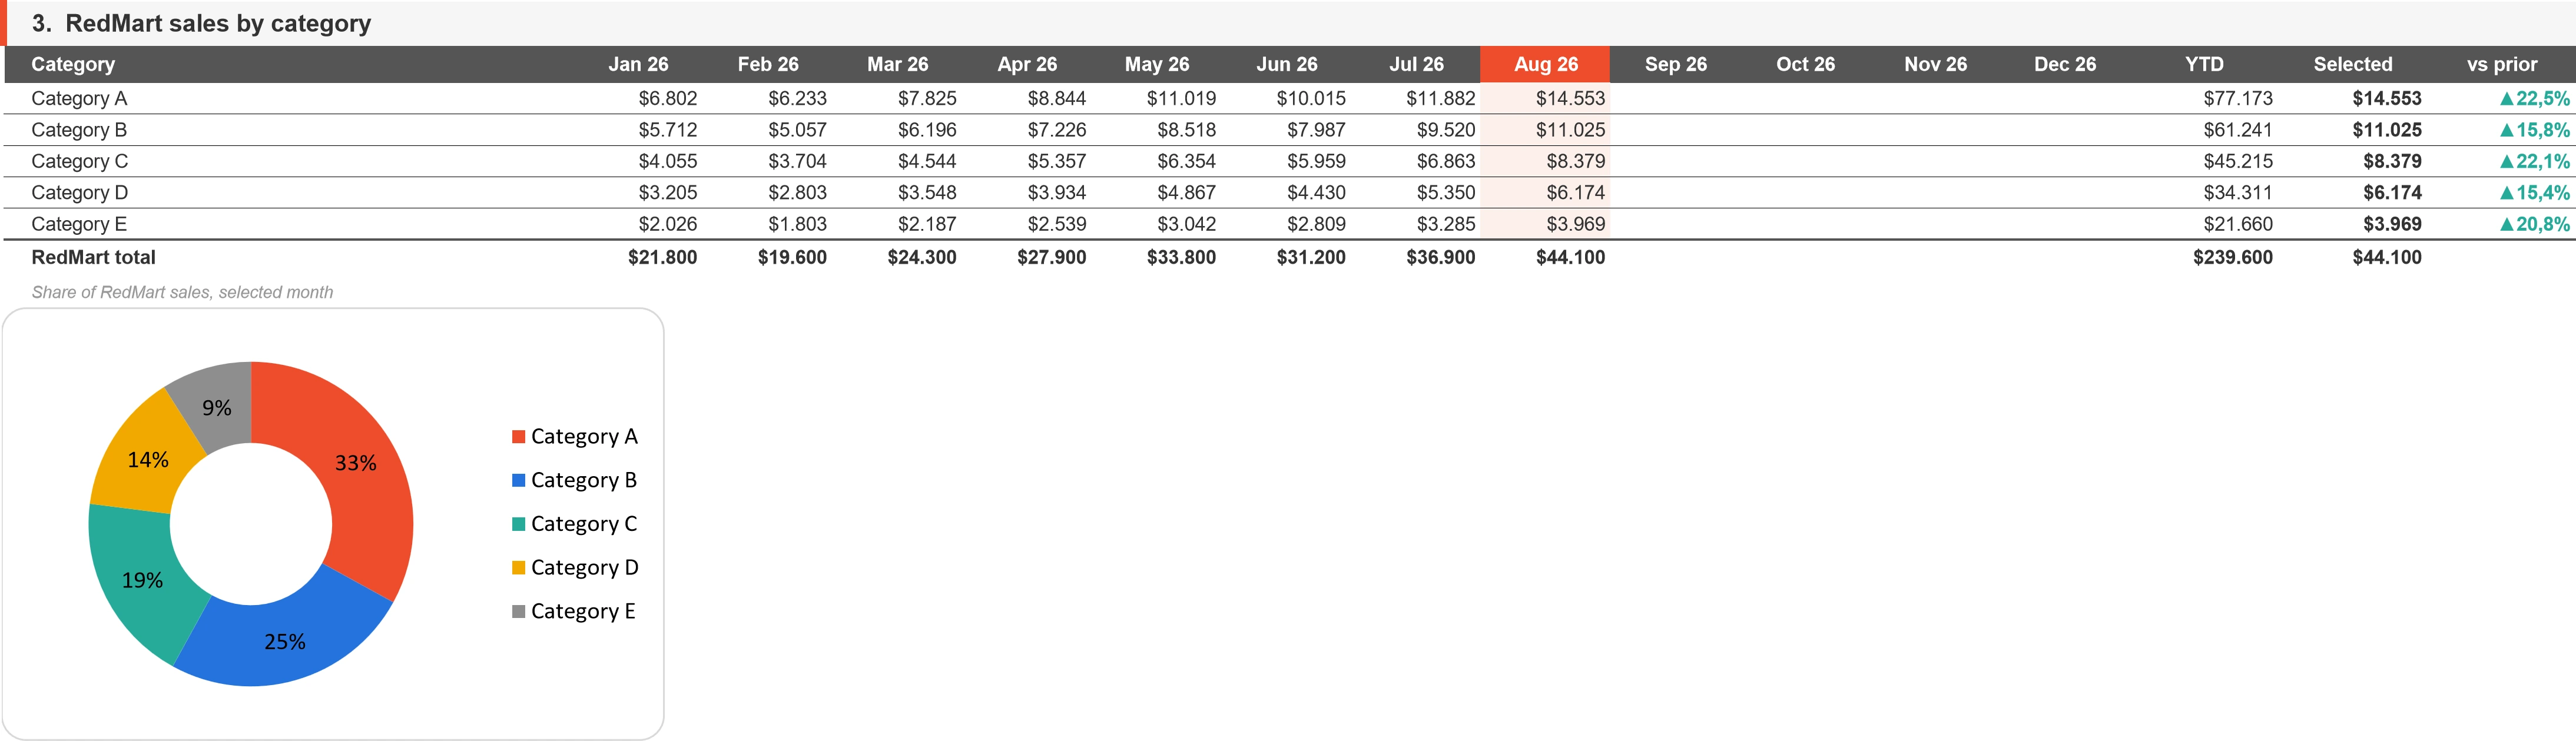
The sales of one channel by category for every month, with the total of the channel. The ring gives the share of each category in the selected month. Here the channel is RedMart.
The data behind it
The sales of that channel by its own product categories, entered month by month.
How to read it
The ring holds the same shares as the Categories panel of the dashboard. Here the months before stand beside them.
What the store owner gets
You see whether a category is gaining or losing ground over the months, not only where it stands in one of them.
Scroll sideways to see all of it, or open the picture.
What it shows
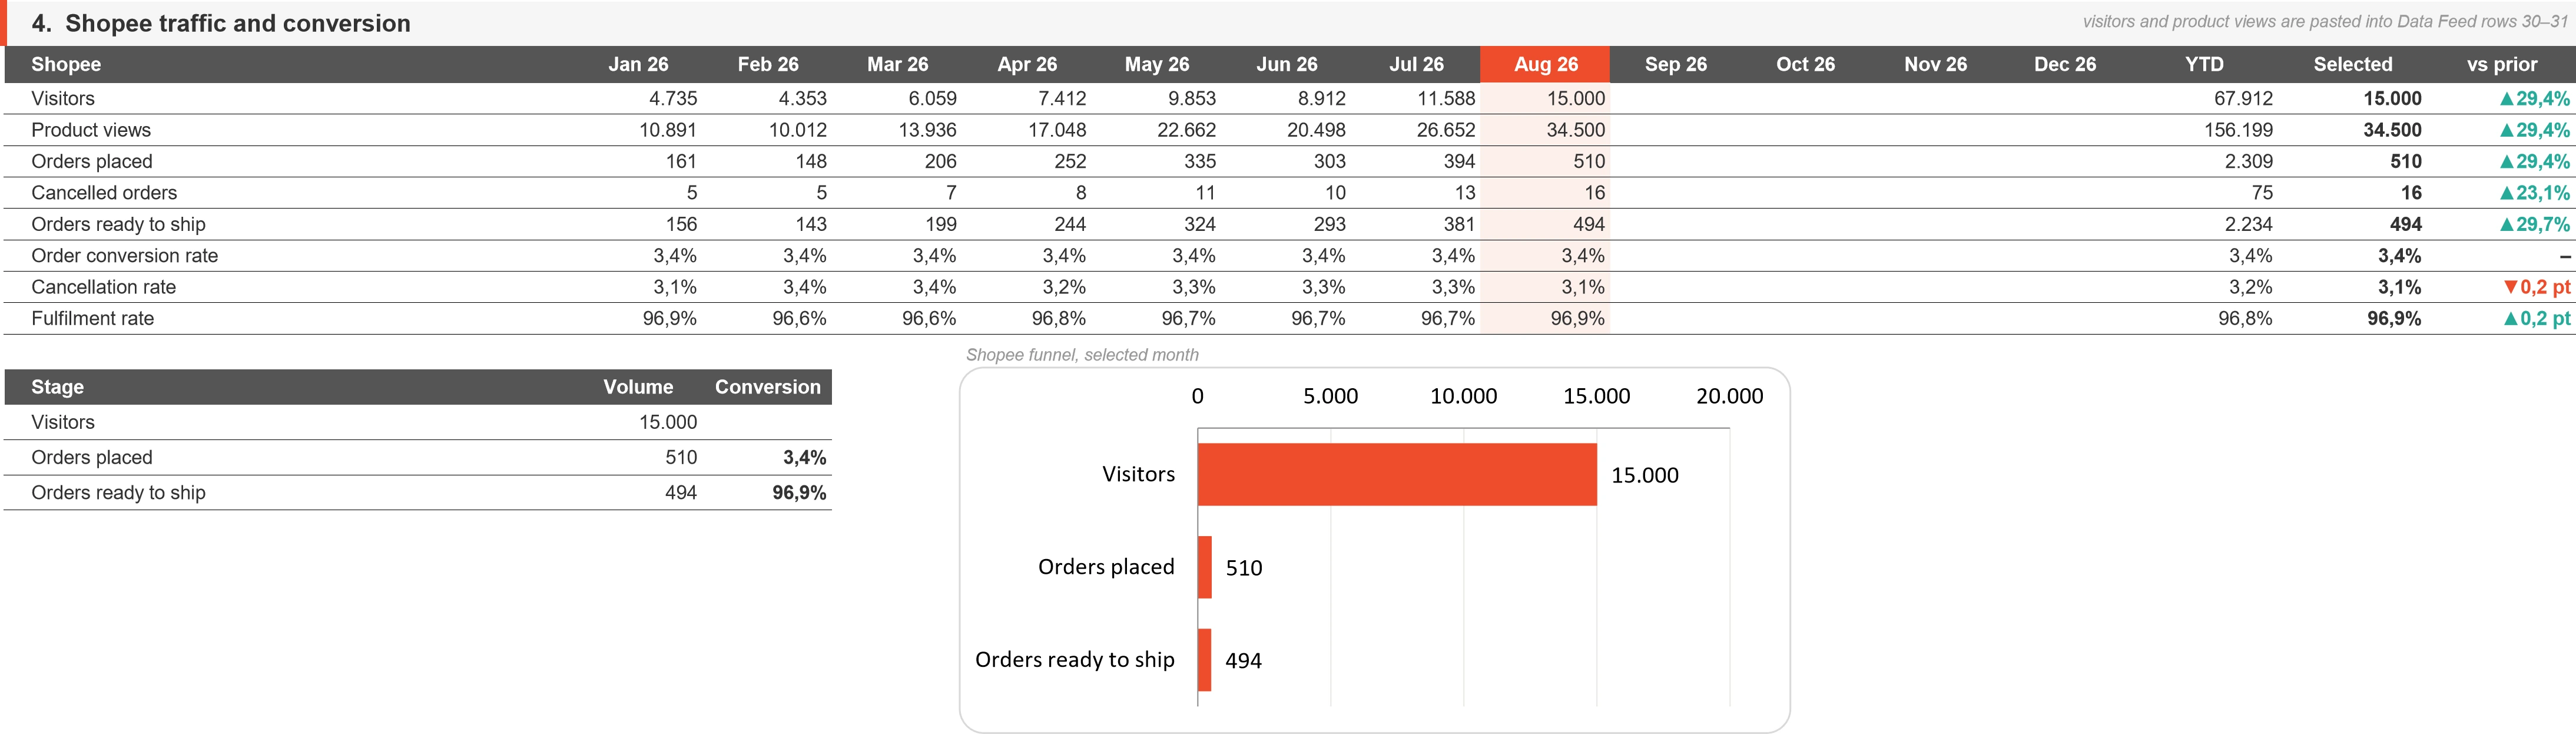
For the Shopee store: visitors, product views, orders placed, cancelled orders and orders ready to ship for every month, with three rates. Under the table, the funnel of the selected month.
The data behind it
Visitors and product views are typed in from the traffic page of Seller Centre. Order conversion rate is orders placed for each visitor. Cancellation rate is cancelled orders out of orders placed. Fulfilment rate is orders ready to ship out of orders placed.
How it works
These figures exist for Shopee only. Shopee conversion and Shopee cancellations on the dashboard are two of the rates in this table.
What the store owner gets
You see how many visits become orders and how many orders are ready to ship, month by month.
Scroll sideways to see all of it, or open the picture.
What it shows
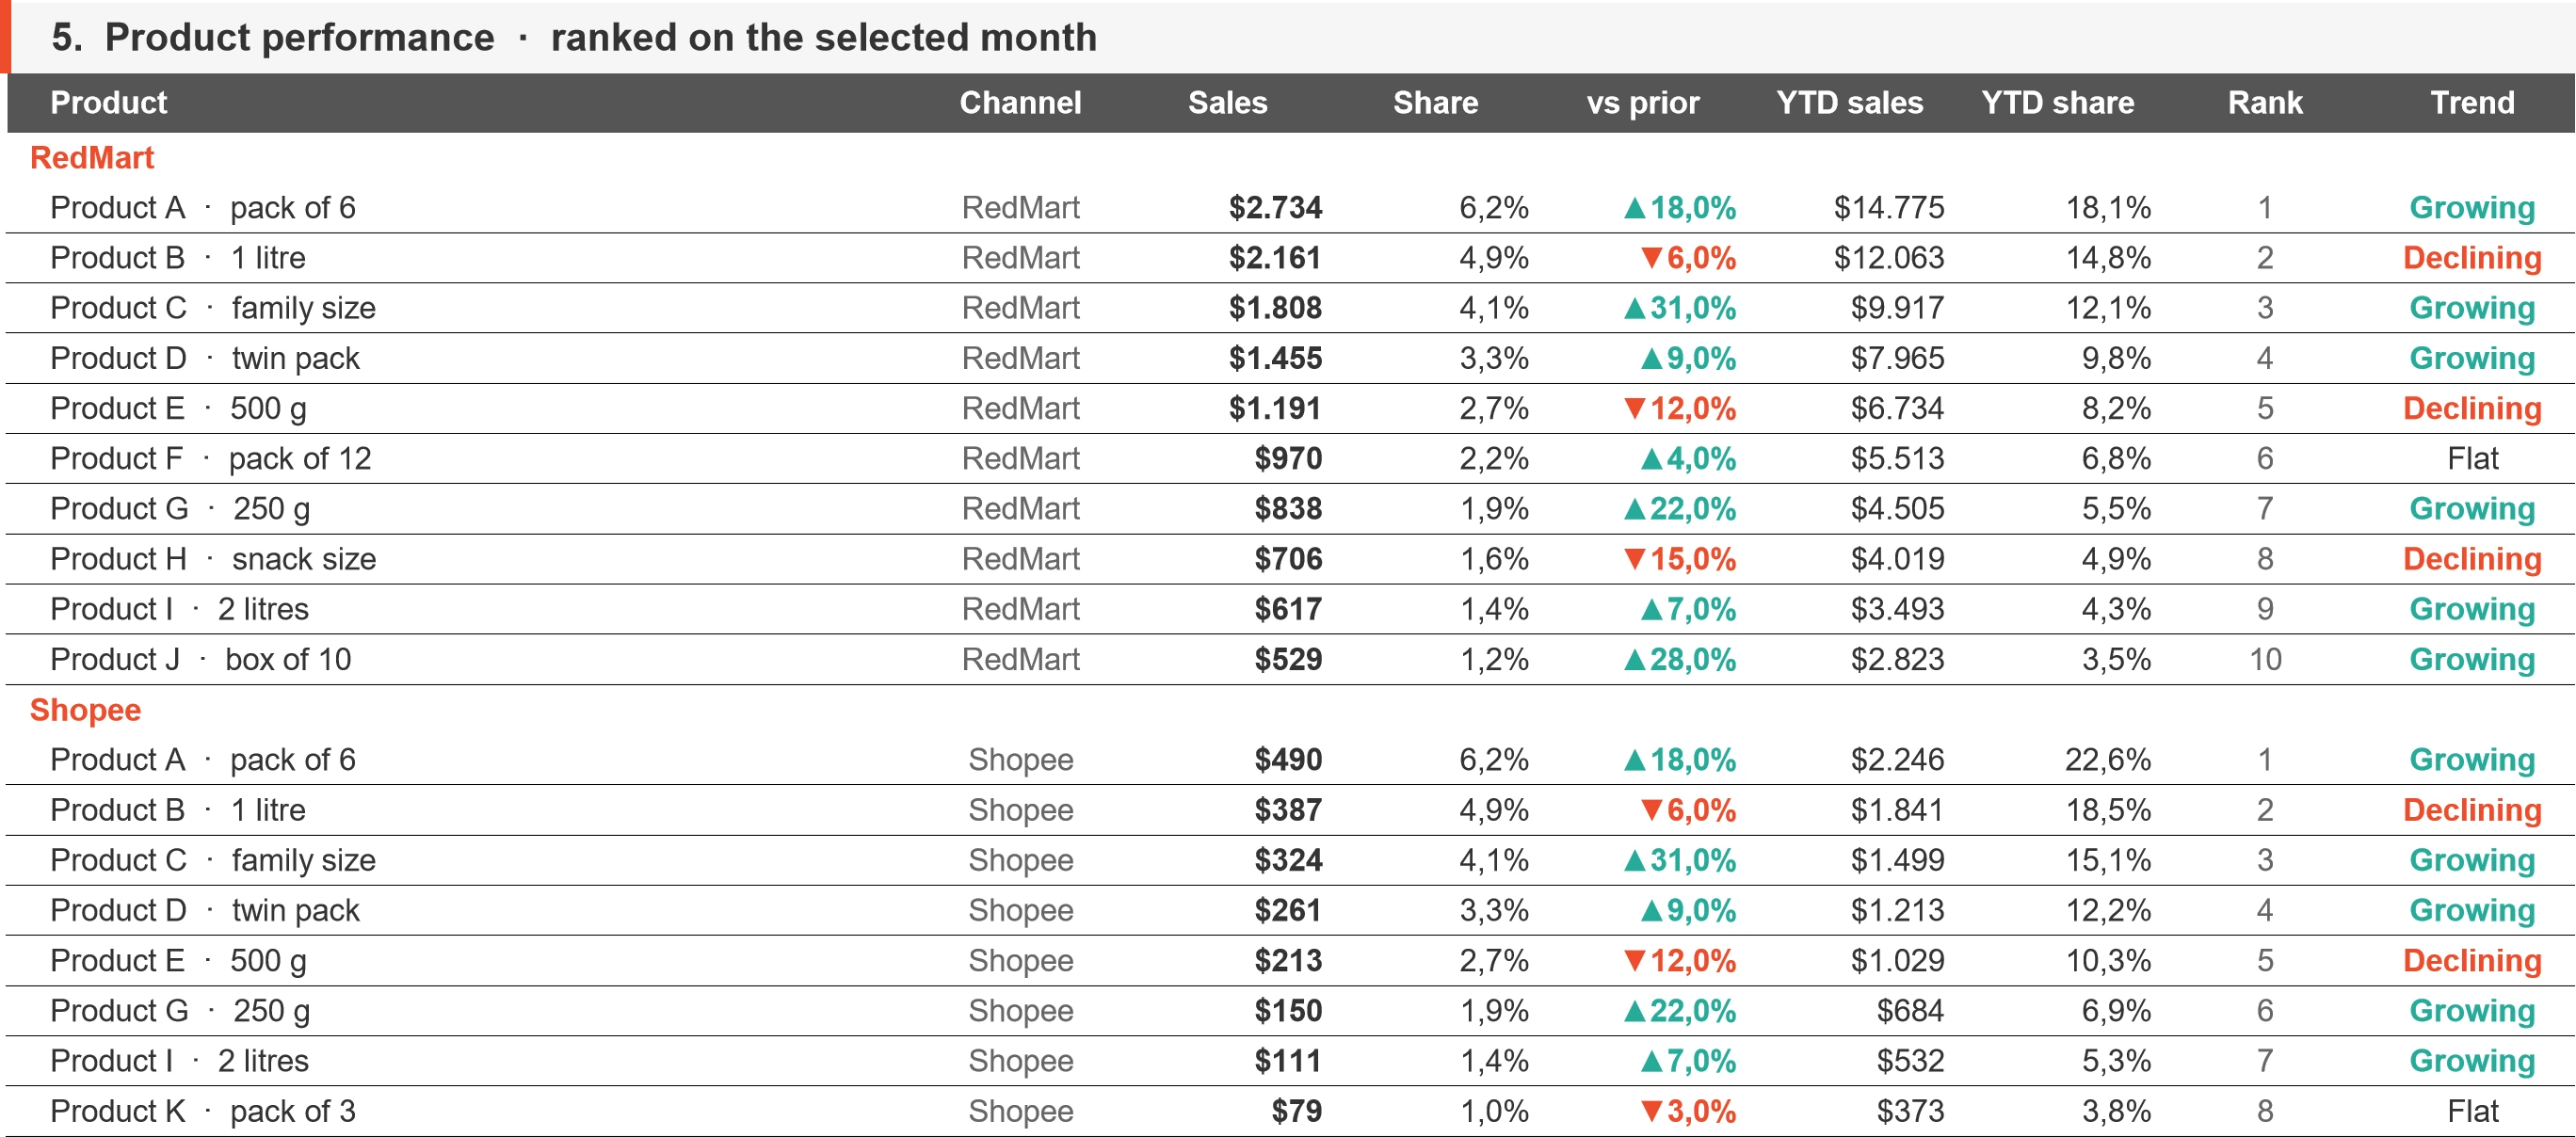
The whole ranking behind Top products: every product tracked on a channel, with its sales, share and change in the selected month, its sales and share in the year to date, its rank and its trend.
The data behind it
The top products of each channel are tracked month by month. The ranking lists up to ten of them, by their sales in the selected month.
How to read it
The first five rows of each channel are the five on the dashboard. The last column names the trend of a product: growing, declining or flat.
What the store owner gets
You see past the first five: which products further down are rising or falling, before deciding what to restock, promote or review.
Scroll sideways to see all of it, or open the picture.
What it shows
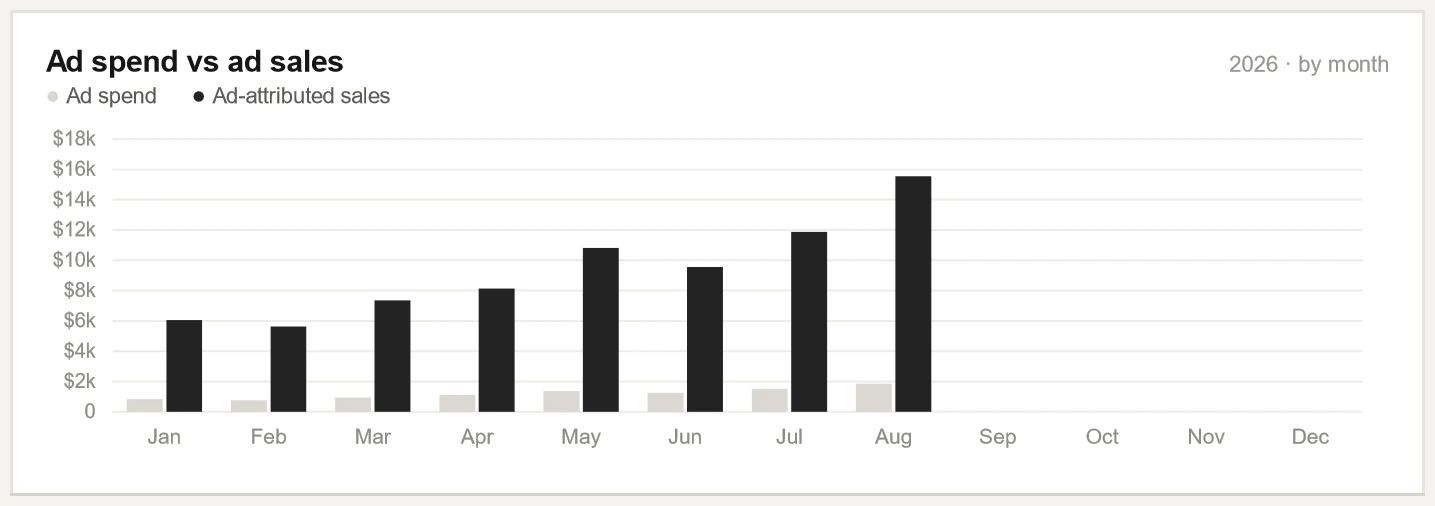
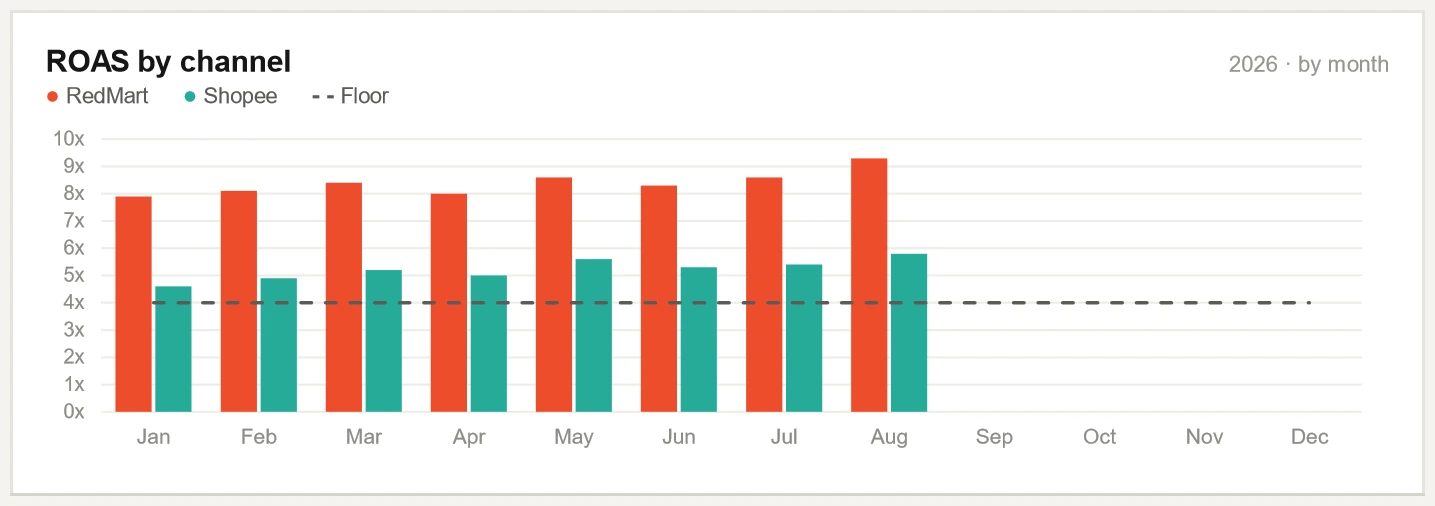
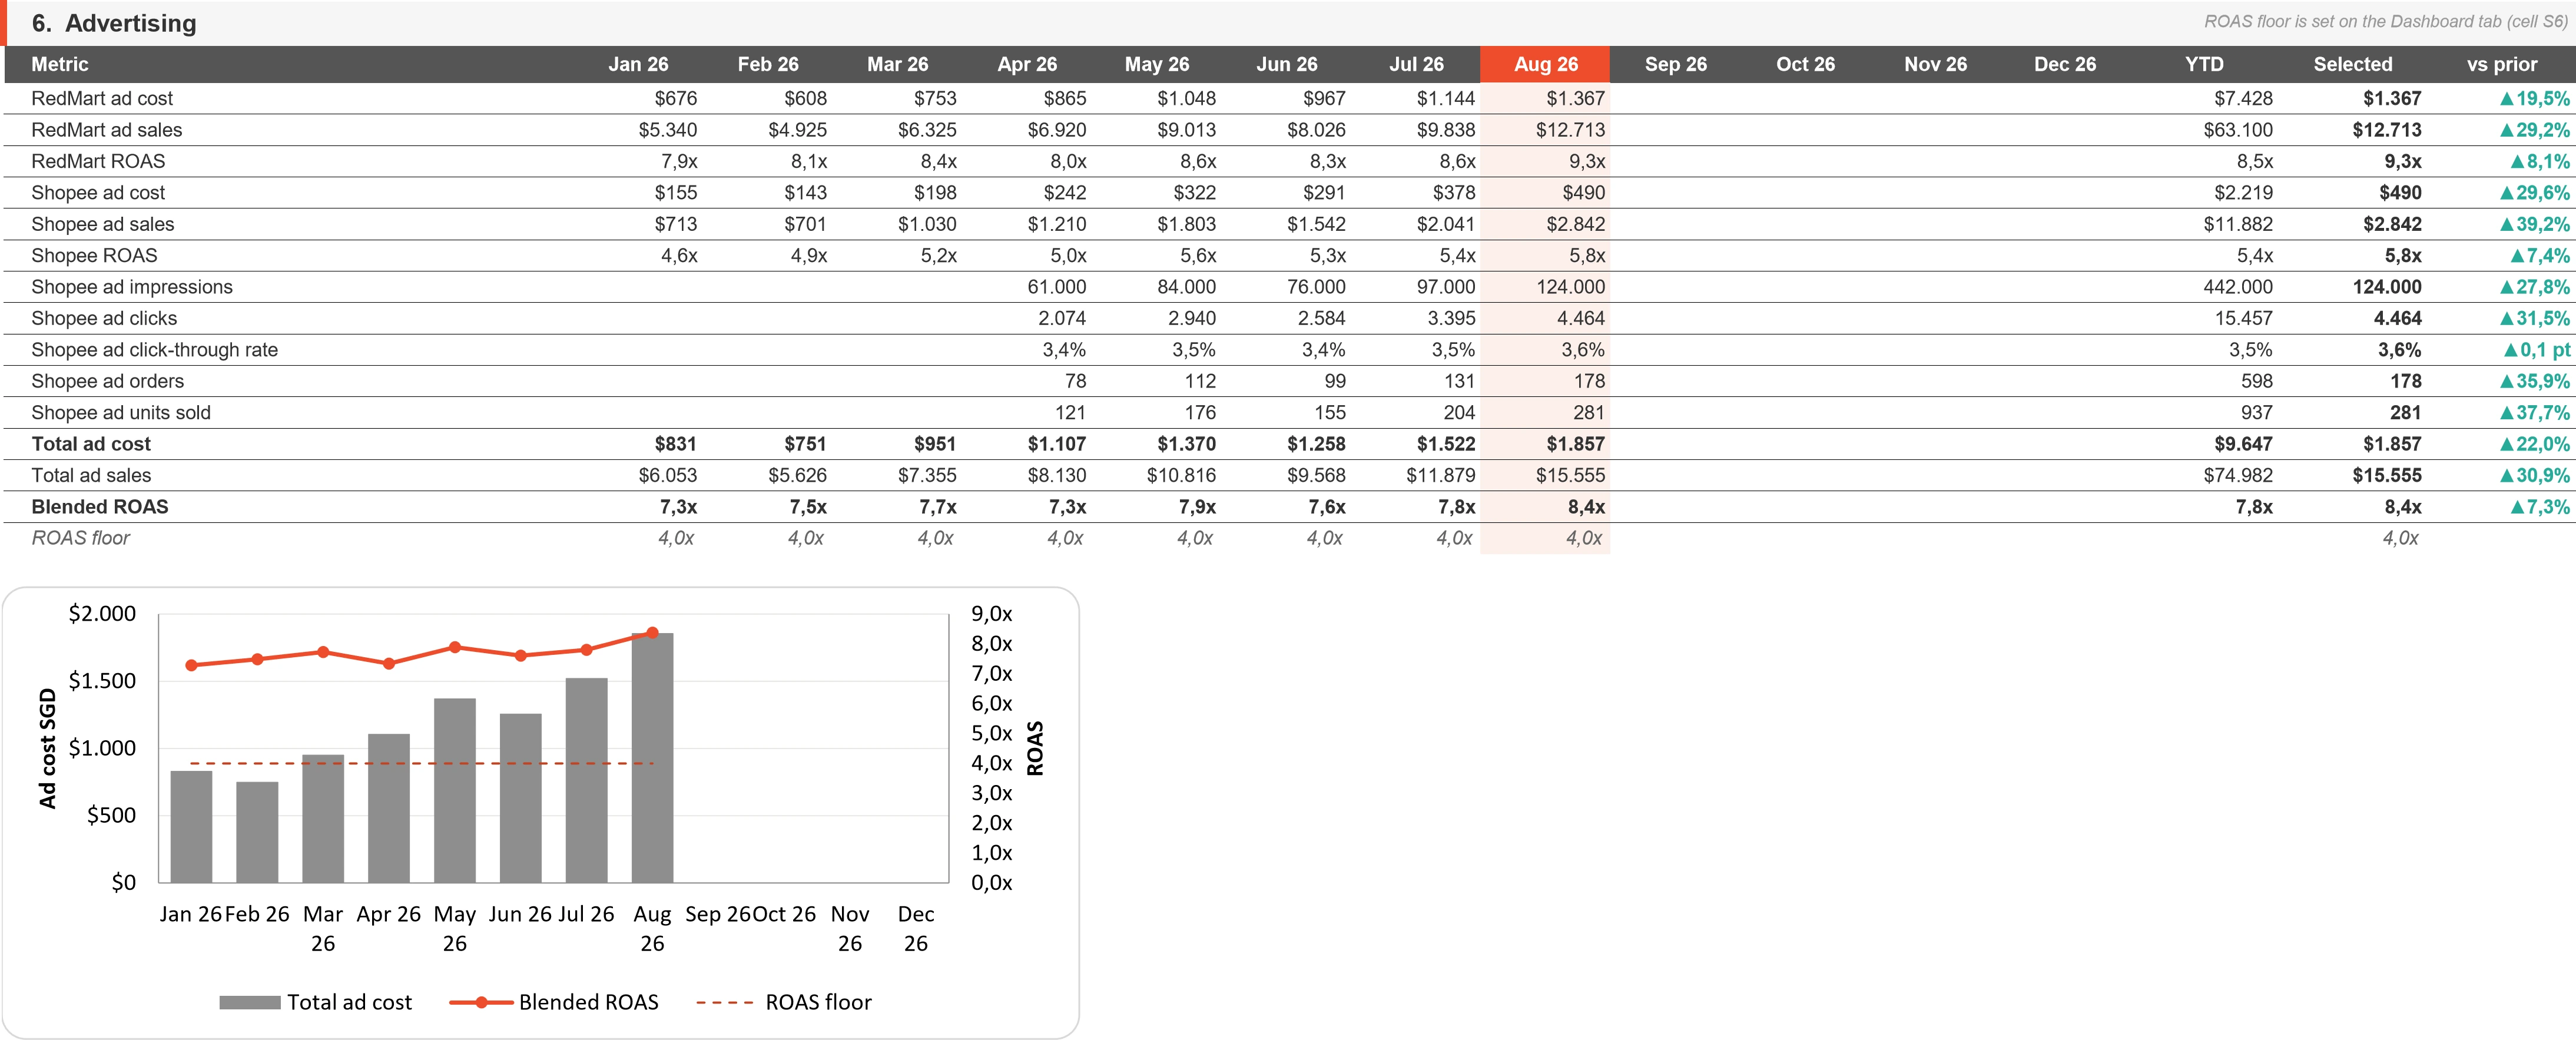
Ad cost and ad sales for each channel and in total, month by month, with the detail of Shopee ads: impressions, clicks, click through rate, ad orders and ad units. The chart sets total ad cost beside return on ad spend and the floor.
The data behind it
The ads report of each channel. The detail of Shopee ads is typed in each month.
How to read it
The floor is the last row of the table and the dashed line of the chart: the one number set on the dashboard, 4 here.
What the store owner gets
You see what each channel spent on ads and what those ads sold in every month, before the ad budget is discussed.
Scroll sideways to see all of it, or open the picture.
What it shows
The profit of the selected month, line by line and channel by channel, with each line also as a share of sales and for the year to date.
The data behind it
Sales and ad cost are what the marketplaces report. Platform fees, cost of goods and packaging are modelled. On Shopee the fees are the commission and transaction fees actually charged, from the order exports, plus the service fee at its rate.
How to read it
Net profit is sales less the four lines above it, before our own fee. Net margin is net profit out of sales.
What the store owner gets
You see which channel earns the profit and which line takes most from it, and you know which lines are a model.
Scroll sideways to see all of it, or open the picture.
What it shows
The last line of the tab: a check, and its answer.
How it works
Sales, orders, ad cost and ad sales must agree between the tab the figures are entered in and the tab that works them out. Every difference must read zero, or the line names the rows to check.
What the store owner gets
You can see that the totals of a report agree before you read the rest of it.
What else is in the workbook
The dashboard is the first tab of one workbook. Here the workbook also holds the tabs below: what the page is built from and what our team works from.
What the page is built from
The monthly table
The table the figures of a month are entered in, one column a month, with the fees Shopee actually charged, taken from the order exports. You can trace a figure of the page back to where it was entered.
The calculation tab
One row for each metric and one column for each month. It works out every ratio and the year to date, and marks each cell as linked, typed in or calculated, so you can see where a figure comes from.
The product tabs
The products with the highest sales on each channel, month by month, and a list that says which listing on one marketplace is which on the other, with the cost of each pack. You see one product across both marketplaces and the cost counted for it.
What our team works from
Stock position and restock priorities
For each channel: units sold by month, demand a month, stock, days of cover and a tier from out of stock to healthy. You get how many units to order and what that costs.
Lost sales
The share of units filled, and what the orders left unfilled cost in sales. You see that cost as an amount.
The ad plan
The ad spend, ad sales and share of sales of each channel in the last month, and a proposed monthly budget. You get a budget to decide on.
Floor prices
For the top fifty products: the lowest price at which a product still covers its cost and fees, and the room for discount that leaves. You know how far a price can come down.
The campaign calculator
A campaign price for each product, made by giving up a share of its profit, with a flag on any product that would go negative. You see before a campaign which products would lose money at its price.
The promotion plan
For the top fifty products: which promotion mechanic for which product, by its days of stock cover, with a cap on the discount. You see what is planned for a product and how far its discount may go.
From real dashboards, names removed.
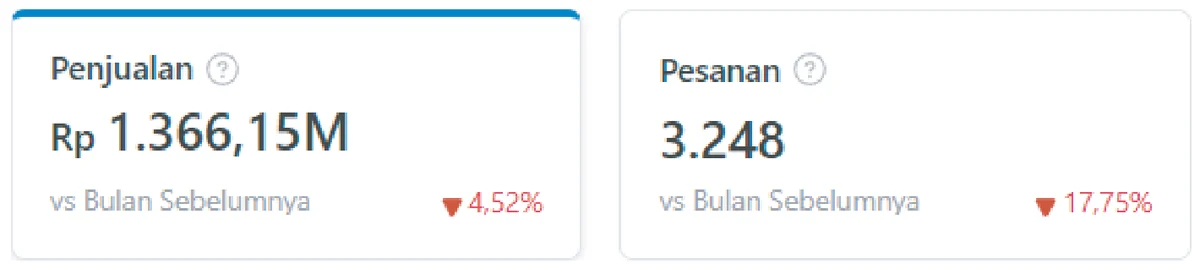
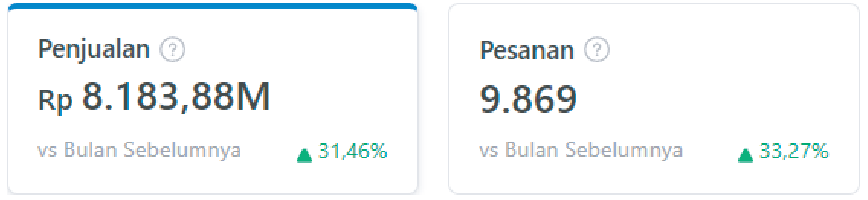
Seller Centre screens from client stores, with store names removed and figures unchanged.Swipe a screen sideways to see all of it, or tap it to open it full size.Tap a screen to open it full size.
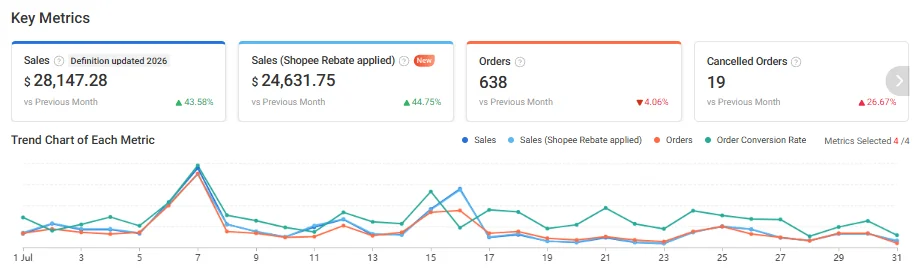
Sales of SGD 28,147.28 in the month, 43.58% above the month before, or SGD 24,631.75 with the Shopee rebate applied. Orders came to 638, 4.06% fewer than the month before.
Profit counted after platform fees, ads, affiliate commission and your product cost (COGS) before any promotion runs
How often do we hear from you?
Every plan includes a monthly report built from your own marketplace exports, with each figure compared with the month before, and a direct WhatsApp line during business hours. Tier II and Tier III add a planning call every two weeks and a written recap every week.
Can we change tier later?
Any time. The difference is prorated for the rest of the month, and the new tier starts the following week.
Tell us about your store and we will tell you which tier or package fits it. If you want the detail first, the Full Store Diagnosis costs USD 20IDR 300.000 per store and takes 3 business days from payment and data.