Skip to content

Case studiesCase 02, Food and beverage brand

A target of IDR 100 million a month, passed in the second month.

Sales a month3.7 times

BeforeMarch 2026

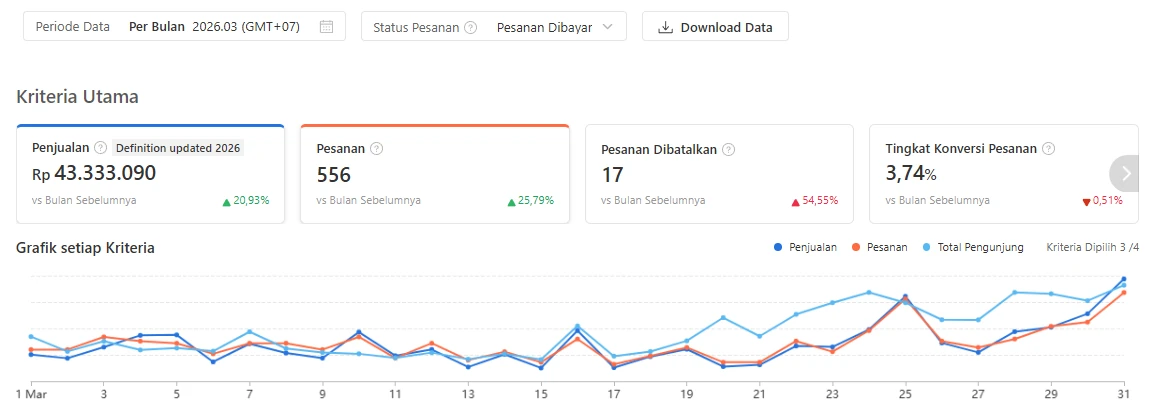
IDR43.33million

AfterJuly 2026

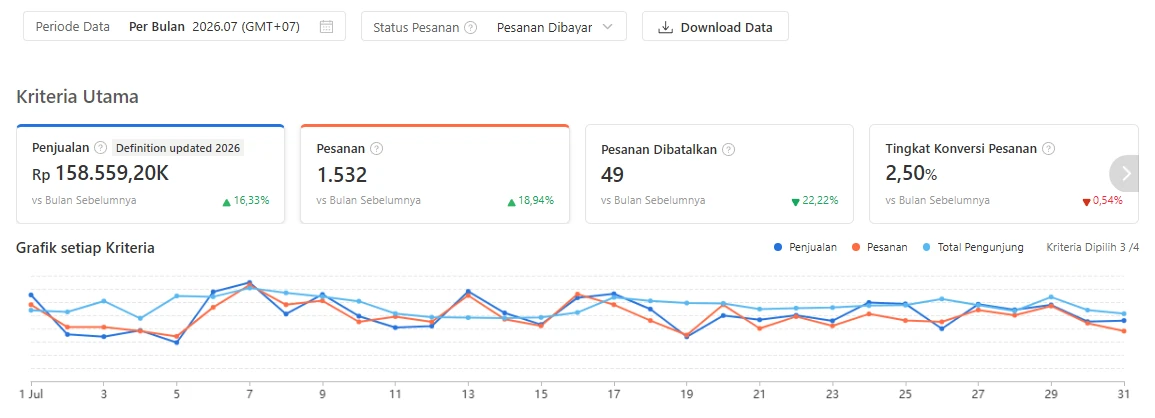
IDR158.56million

A food brand on Shopee in Indonesia that sold under IDR 50 million a month at the start of 2026. An audit in April set a target of IDR 100 million a month. This is what the audit found, what we changed, where the store stood in July, and what happened after the peak. The store stays unnamed. The figures are the ones on its screens.

  • Food and beverage
  • Shopee, TikTok Shop and Tokopedia
  • Indonesia
  • Mar to Sep 2026
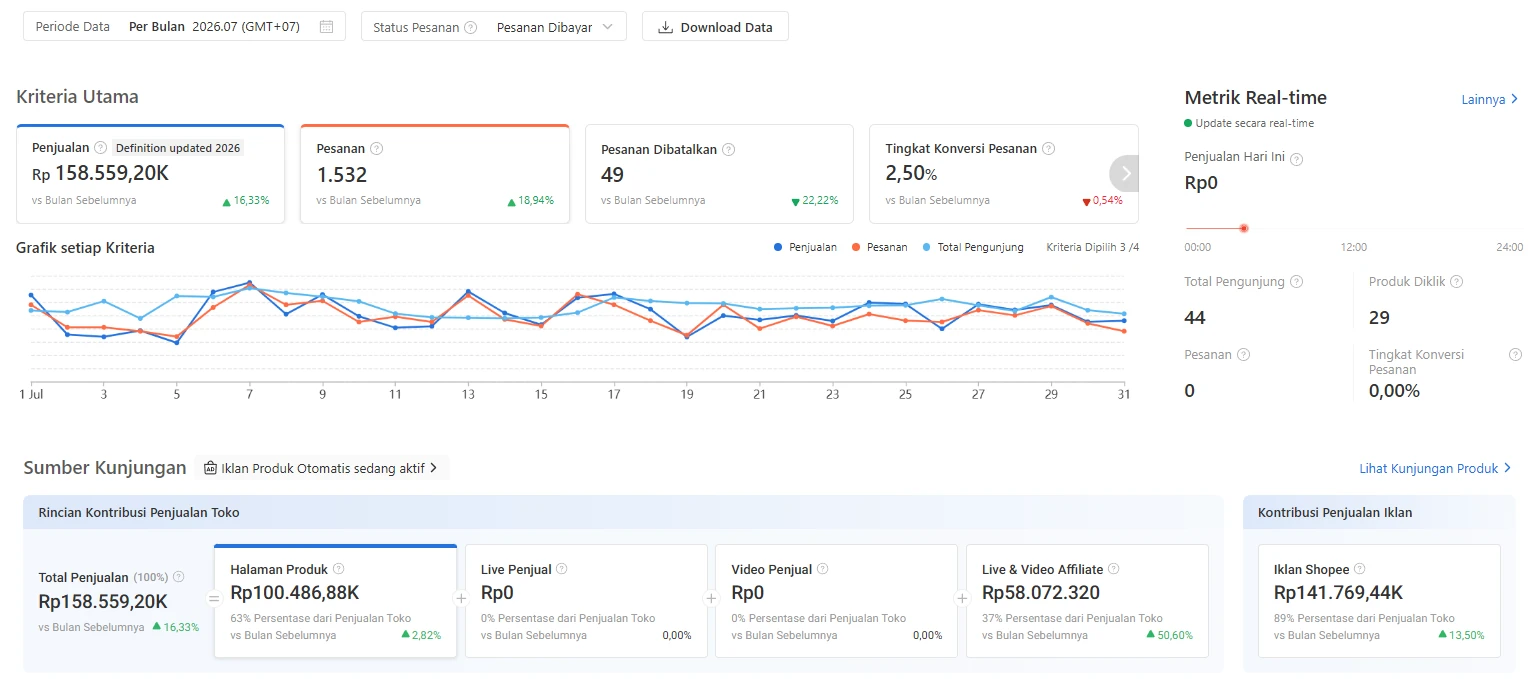
AfterJuly 2026
Screenshot: After. July 2026. Shopee Seller Centre, Performa Toko, Tinjauan Open the screenshot at its own size

Shopee Seller Centre, Performa Toko, Tinjauan

The target
IDR 100 million
A month, set in the April audit. May closed at IDR 134.59 million.
Passed in May
Orders a month
1,532
July 2026. From 556 in March 2026.
2.8 times
Two months after the peak
IDR 109.97 million
September 2026. 2.5 times March, 13.15% below August.
Above the target

From the Shopee Seller Centre of the store, per month, paid orders. The multiples are our arithmetic.

In short

  1. The problem

    In the first quarter of 2026 the store sold under IDR 50 million a month, and a smaller share of its visitors ordered each month. Ads were already running, but the largest single ad was a shop banner with the weakest return of the six.

  2. What we changed

    An audit on 10 April 2026 ranked every product and every running ad by what it returned, and set a target of IDR 100 million a month. The ad budget went to what paid back, a new product was put at the centre, creators sold on commission, and three marketplaces went into one monthly report.

  3. The result

    May closed at IDR 134.59 million, past the target, and July at IDR 158.56 million, 3.7 times the sales of March. The share of visitors who ordered fell from 3.74% to 2.50% on the way, and two months after the peak September still closed at IDR 109.97 million.

The problem

A quarter under IDR 50 million a month, with conversion slipping.

January to March 2026

Orders were rising but each one was worth less, a smaller share of visitors was ordering, and the ad that took the most budget was the one that returned the least.

  • BeforeMarch 2026: sales of IDR 43.33 million a month, the month before the audit.
  • AfterJuly 2026: sales of IDR 158.56 million a month.
BeforeJanuary 2026
Screenshot: Before. January 2026. Shopee Seller Centre, Performa Toko, Tinjauan Open the screenshot at its own size
Shopee Seller Centre, Performa Toko, Tinjauan

BeforeMarch 2026
Screenshot: Before. March 2026. Same screen, the month before the audit Open the screenshot at its own size

Same screen, the month before the audit

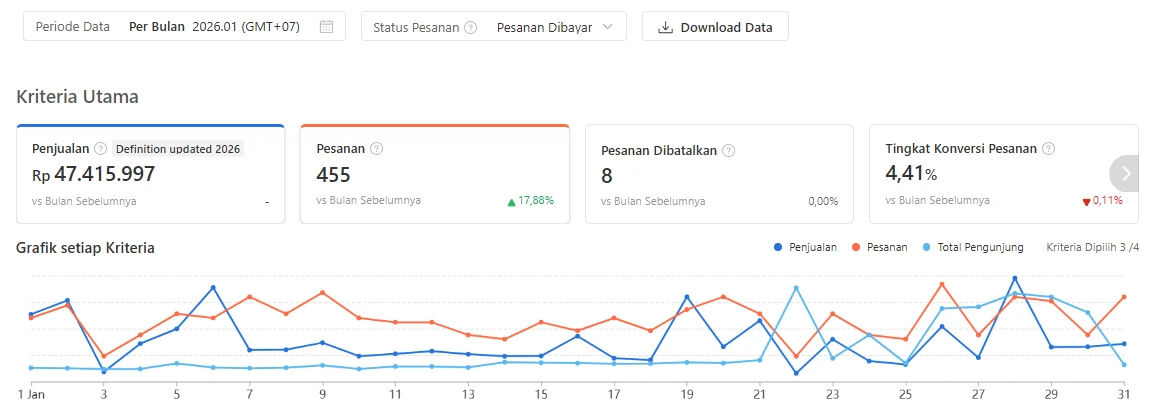
The store sold IDR 47.42 million in January 2026 and IDR 43.33 million in March, from 455 and 556 orders. More orders, but smaller ones, and order conversion slid from 4.41% to 3.74%.

In April we audited the quarter from the store exports. Ads were already running, at about IDR 5.4 million a month, but the largest single ad was a shop banner with the weakest return of the six. The target was IDR 100 million a month.

In the audit, 10 April 2026

Sales a month, first quarter
IDR 44.1 million on average
Target
IDR 100 million a month
Order conversion, by month
4.55%, 4.28%, 4.03%
Cancelled orders
3.4% in January, 5.7% in March
Repeat buyers, January
2.45%
Largest ad spend
Shop banner, weakest return

From the store exports, on orders ready to ship. Not on the screens above.

Time stamps on these screens
Per Bulan 2026.01 (GMT+07), 2026.03 (GMT+07)
January and March 2026, Jakarta time.
Status Pesanan: Pesanan Dibayar
Paid orders only, on both screens.
vs Bulan Sebelumnya
Against the month before. January sales print a dash: Shopee shows no comparison with December 2025, which it labels mixed definition.
Rp 47.415.997
A dot marks thousands: IDR 47,415,997.
What we changed

Budget to what paid back, and to a new product that took off.

The audit ranked every product and every running ad by what it returned. Four things followed.

  • Ad budget by return

    Each ad was ranked by the sales it brought for every rupiah. From 1 May to 17 June most of the product ad budget went to the new product, and spend rose from IDR 8.40 million in April to IDR 16.08 million in July.

  • A new product at the centre

    A product launched in mid March, with its own ad within days, was already finding buyers. After the audit it was put at the centre and became the lead product on Shopee and on TikTok Shop.

  • Affiliates and creators

    Creators on Shopee and TikTok Shop sell on commission. Since September each one is scored before we write, and a sample goes out only once the product is in their showcase.

  • Three marketplaces, one report

    Shopee, TikTok Shop and Tokopedia go into one monthly workbook: sales for each product, and ad cost, fees and estimated profit by channel.

None of this is a trick. It is one loop, repeated: rank what sells, move the money there, and check the profit after fees.

The sections that follow show the screens before and after, starting with the first two months.

What was done, and when

  1. 10 April 2026Audit of January to March. Every product and every running ad ranked. Target set.
  2. 21 MaySecond audit, across Shopee, TikTok Shop and Tokopedia. 35 actions listed by channel.
  3. 17 JuneProfit for each product worked out for May, with a first pass for June: fees, vouchers and ad cost.
  4. 7 AugustOne workbook for three marketplaces, January to July, with stock cover.
  5. 14 SeptemberAffiliate procedure rewritten, in its third version.
  6. In the workbookMonthly figures side by side: sales for each product, ad cost and estimated profit by channel.

The first two months, April and May 2026

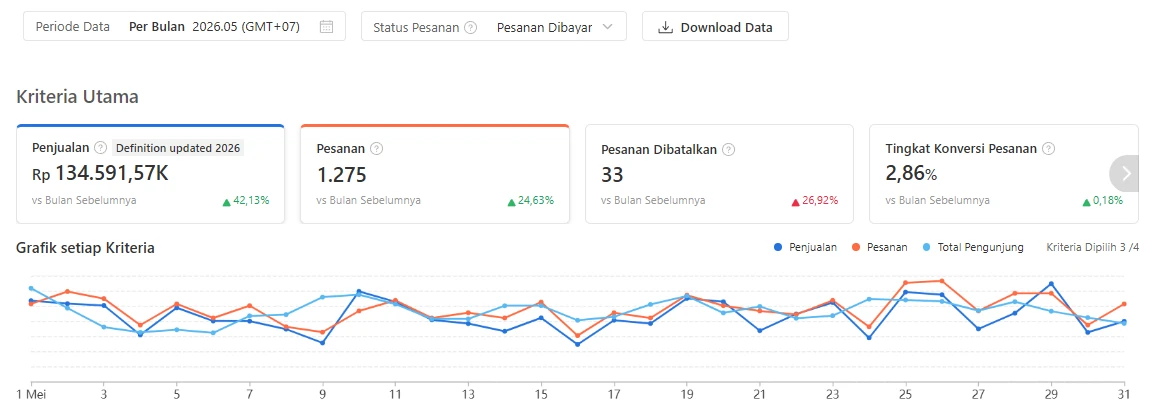
April closed at IDR 94.70 million, May at IDR 134.59 million.

The store passed its target in the second month, and it got there on far more visitors, not because a larger share of them ordered.

Month oneApril 2026
Screenshot: Month one. April 2026. Same screen as March Open the screenshot at its own size

Same screen as March

Month twoMay 2026
Screenshot: Month two. May 2026. Same screen Open the screenshot at its own size

Same screen

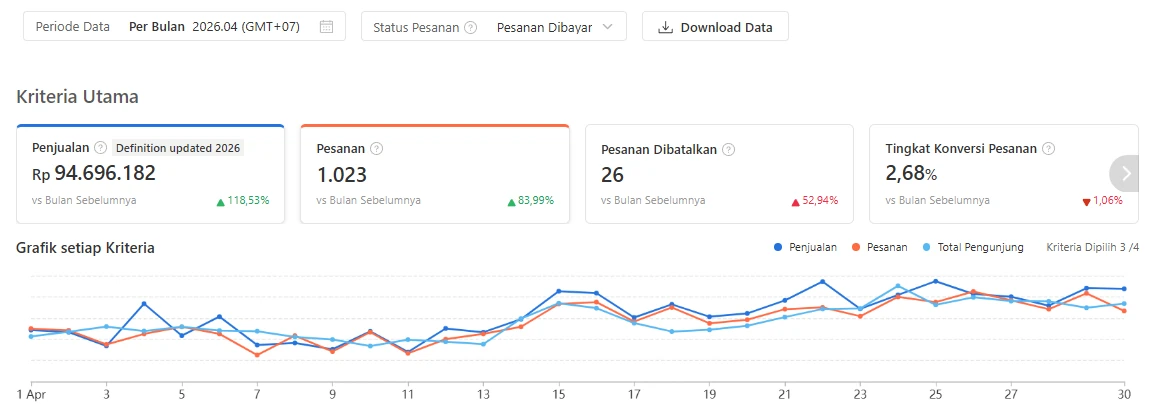
The first two months after the audit. April 2026 closed at IDR 94.70 million from 1,023 orders, up 118.53% on March. May closed at IDR 134.59 million from 1,275 orders, past the target.

Conversion did not follow: 2.68% in April and 2.86% in May, against 3.74% in March. The growth came from far more visitors, not from a better rate.

On the two screens
Apr 2026May 2026
Sales, IDR million94.70up 118.53%134.59up 42.13%
Orders1,023up 83.99%1,275up 24.63%
Cancelled orders26up 52.94%33up 26.92%
Order conversion2.68%down 1.06%2.86%up 0.18%

Changes against the month before, as Shopee shows them.

Time stamps on these screens
Per Bulan 2026.04 (GMT+07), 2026.05 (GMT+07)
April and May 2026, paid orders.
Rp 134.591,57K
K is thousand and the comma is a decimal point: IDR 134,591,570.
1 Mei
The chart axis. Mei is May.

Shopee Ads, April to July 2026

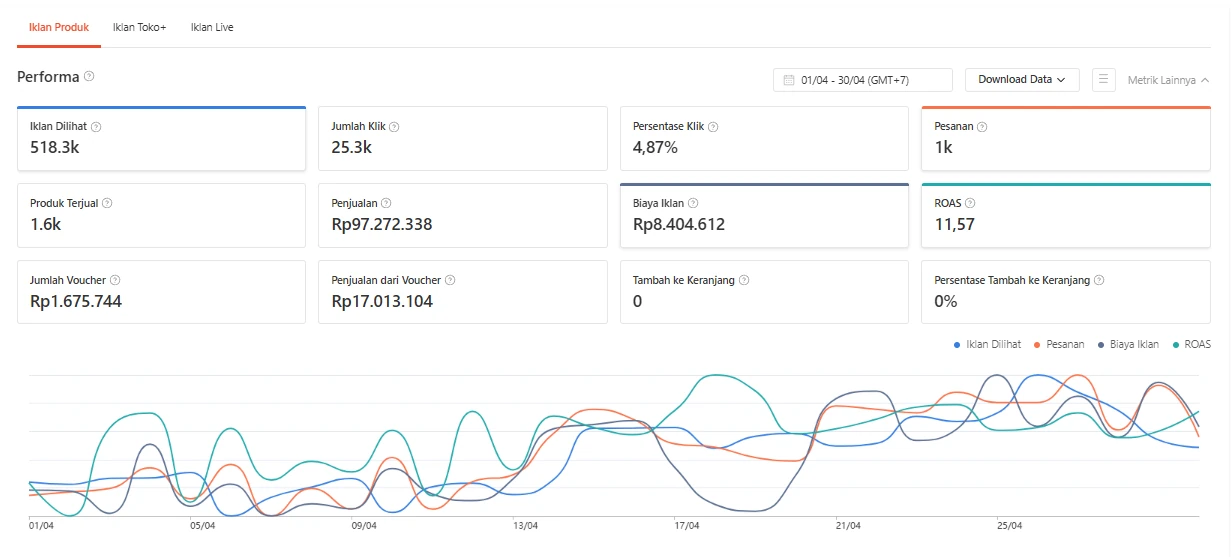
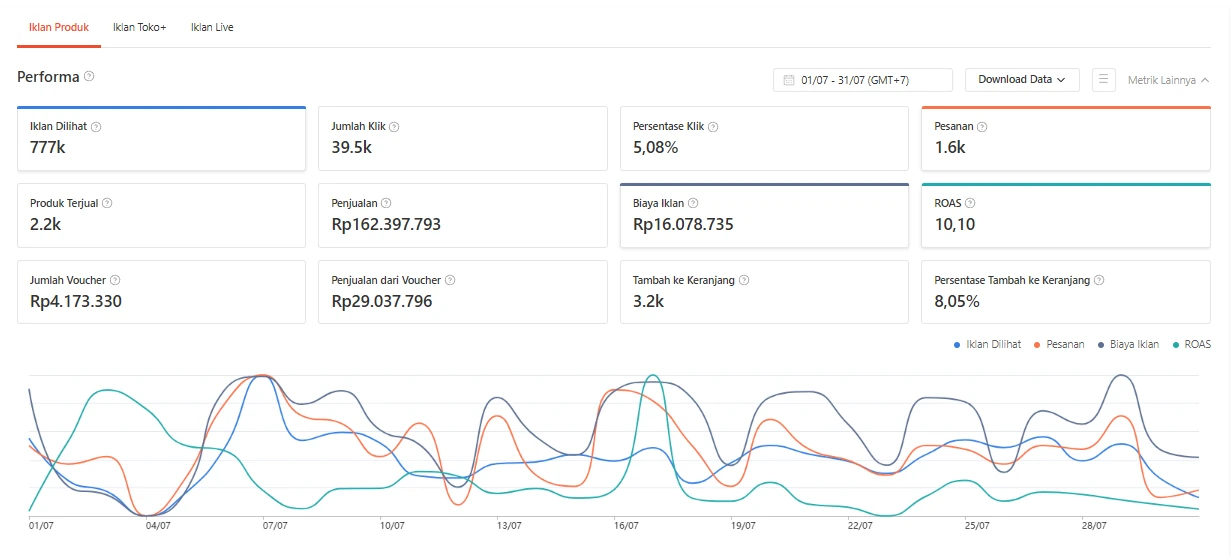
Ad spend nearly doubled. Ad sales went from IDR 97.3 million to IDR 162.4 million.

The store spent more on product ads and sold more through them, and the budget went where the sales were.

Month oneApril 2026
Screenshot: Month one. April 2026. Iklan Shopee, Iklan Produk, Performa Open the screenshot at its own size

Iklan Shopee, Iklan Produk, Performa

AfterJuly 2026
Screenshot: After. July 2026. Same screen Open the screenshot at its own size

Same screen

The product ads page of the store. In April 2026 the product ads sold IDR 97.27 million on IDR 8.40 million of spend. In July they sold IDR 162.40 million on IDR 16.08 million.

Our profit workbook of 17 June shows where the money went: of IDR 14.2 million spent on the five product ads from 1 May to 17 June, IDR 8.9 million was on the new product. Budget followed what sold.

On the two screens
Apr 2026Jul 2026
Ad salesIDR 97,272,338IDR 162,397,793
Ad spendIDR 8,404,612IDR 16,078,735
Clicks25.3 thousand39.5 thousand
Click rate4.87%5.08%

The ads page counts its sales its own way, so they can exceed the paid sales of the month, as they do here.

Time stamps on these screens
01/04 - 30/04 (GMT+7), 01/07 - 31/07 (GMT+7)
April and July. Shopee Ads prints no year. Ad sales in both months equal our monthly report for 2026 to the rupiah.
Rp97.272.338
A dot marks thousands: IDR 97,272,338.
518.3k, 25.3k
On the ads page k is thousand.

Where the sales came from, April to July 2026

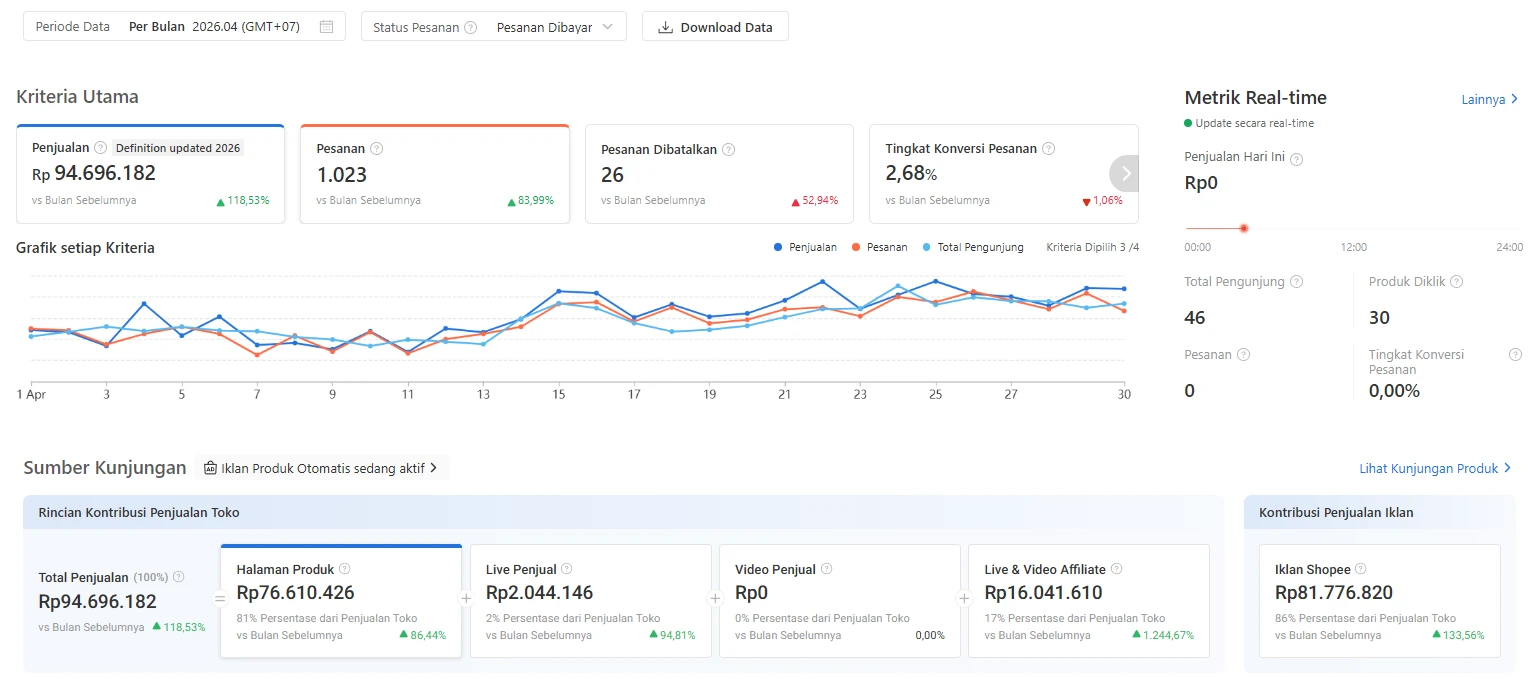
Affiliate sales, IDR 16.0 to 58.1 million a month.

A growing share of the sales came through live and video affiliates, in a store where ads touch most of what is sold.

Month oneApril 2026
Screenshot: Month one. April 2026. Performa Toko, Tinjauan, Sumber Kunjungan Open the screenshot at its own size

Performa Toko, Tinjauan, Sumber Kunjungan

AfterJuly 2026
Screenshot: After. July 2026. Same screen Open the screenshot at its own size

Same screen

The overview splits each month by where the sale happened. In April 2026 live and video affiliates brought IDR 16.04 million, 17% of sales. In July they brought IDR 58.07 million, 37%.

The ads card is a separate count that overlaps the others. It read 86% of sales in April and 89% in July. Paid traffic is the engine of this store, which is why the audit ranked every running ad by its return.

On the two screens
Apr 2026Jul 2026
Product pagesIDR 76,610,426IDR 100,486,880
Live and video affiliateIDR 16,041,610IDR 58,072,320
Seller liveIDR 2,044,146IDR 0
Sales touched by adsIDR 81,776,820IDR 141,769,440

Live and video affiliate is the card on this overview, on paid orders. The affiliate page later in this case is a different count.

Time stamps on these screens
Per Bulan 2026.04 (GMT+07), 2026.07 (GMT+07)
April and July 2026, paid orders.
Metrik Real-time
The side panel shows the day of capture, not the month.
Rp100.486,88K
K is thousand: IDR 100,486,880.

Product pages, March to July 2026

Shoppers adding to cart: 2,058 to 8,076 a month.

Far more shoppers reached the product pages and added to cart, while the share of them who ordered did not improve.

BeforeMarch 2026
Screenshot: Before. March 2026. Performa Toko, Produk, Tinjauan Produk Open the screenshot at its own size

Performa Toko, Produk, Tinjauan Produk

AfterJuly 2026
Screenshot: After. July 2026. Same screen Open the screenshot at its own size

Same screen

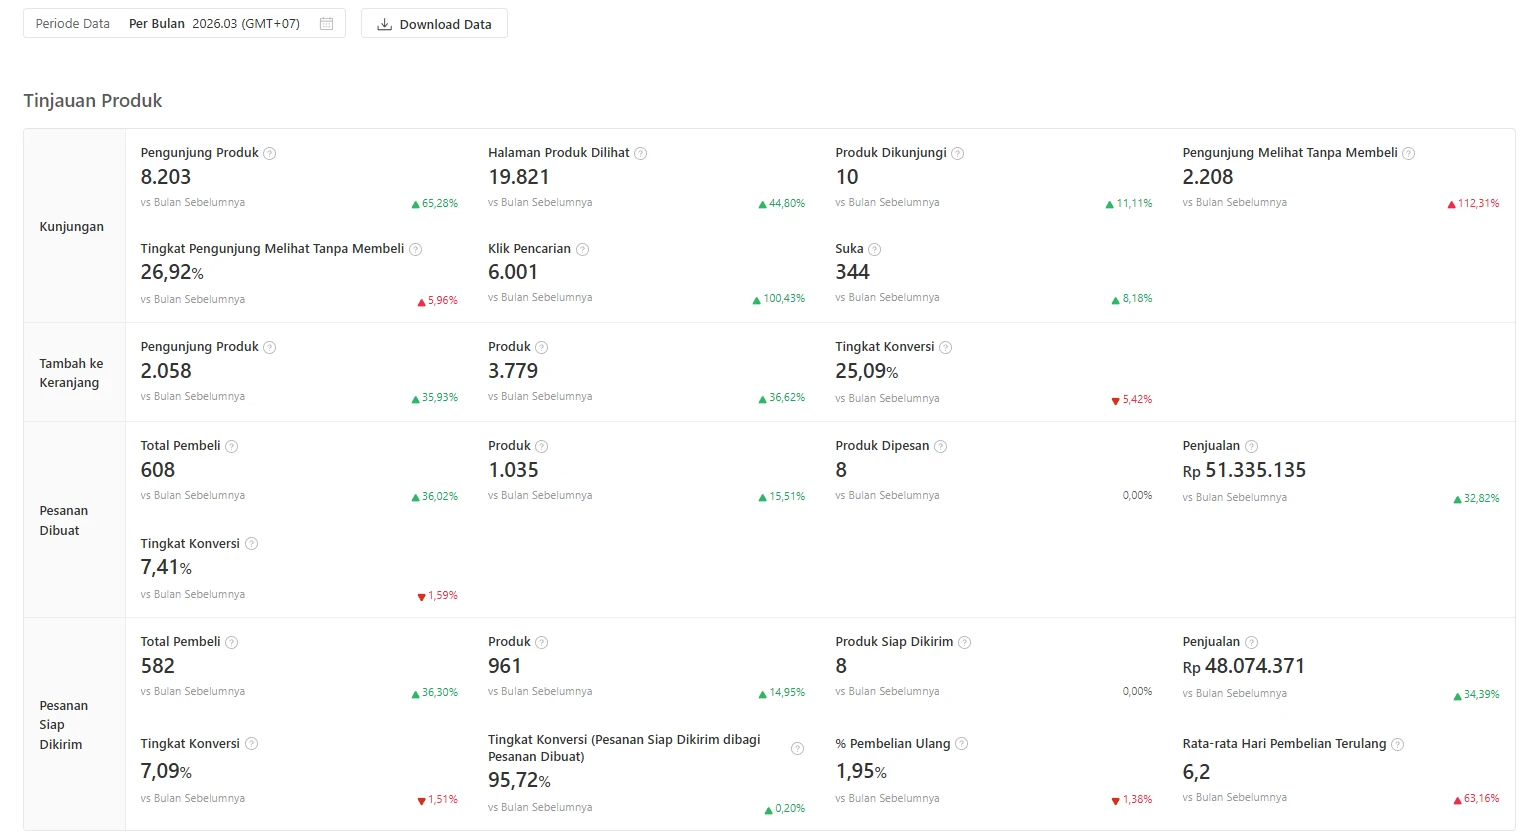
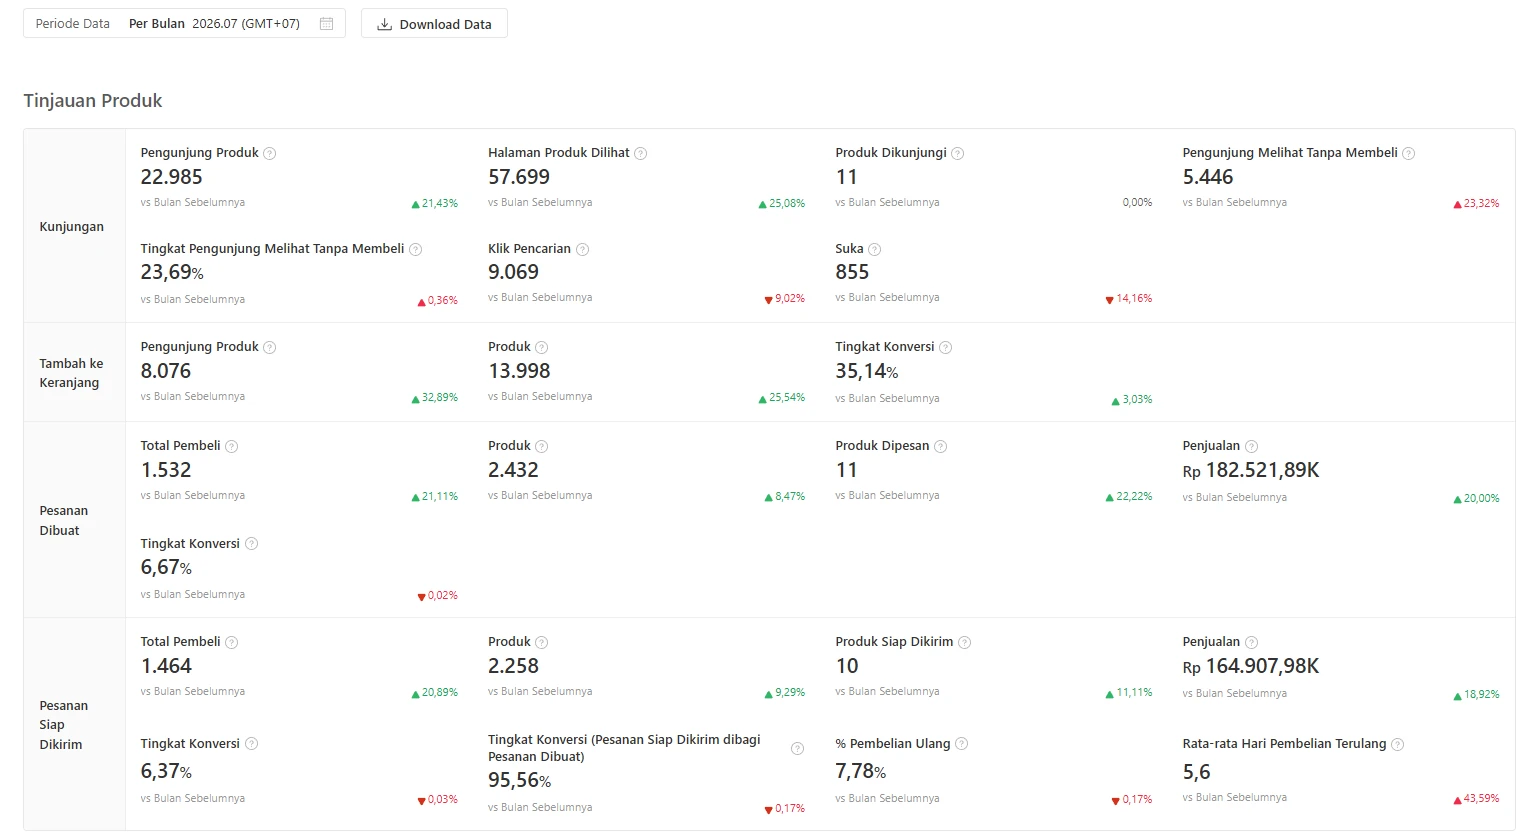
The product overview follows a shopper from the product page to the order. From March to July 2026 page views rose from 19,821 to 57,699 and shoppers adding to cart from 2,058 to 8,076.

The last step did not improve: 7.41% of product visitors ordered in March and 6.67% in July.

On the two screens
Mar 2026Jul 2026
Search clicks6,0019,069
Add to cart rate25.09%35.14%
Buyers, orders created6081,532
Repeat purchase rate1.95%7.78%
Time stamps on these screens
Per Bulan 2026.03 (GMT+07), 2026.07 (GMT+07)
March and July 2026.
Pesanan Dibuat, Pesanan Siap Dikirim
Orders created, then orders ready to ship.
Klik Pencarian
Clicks that came from Shopee search.

Traffic, March to July 2026

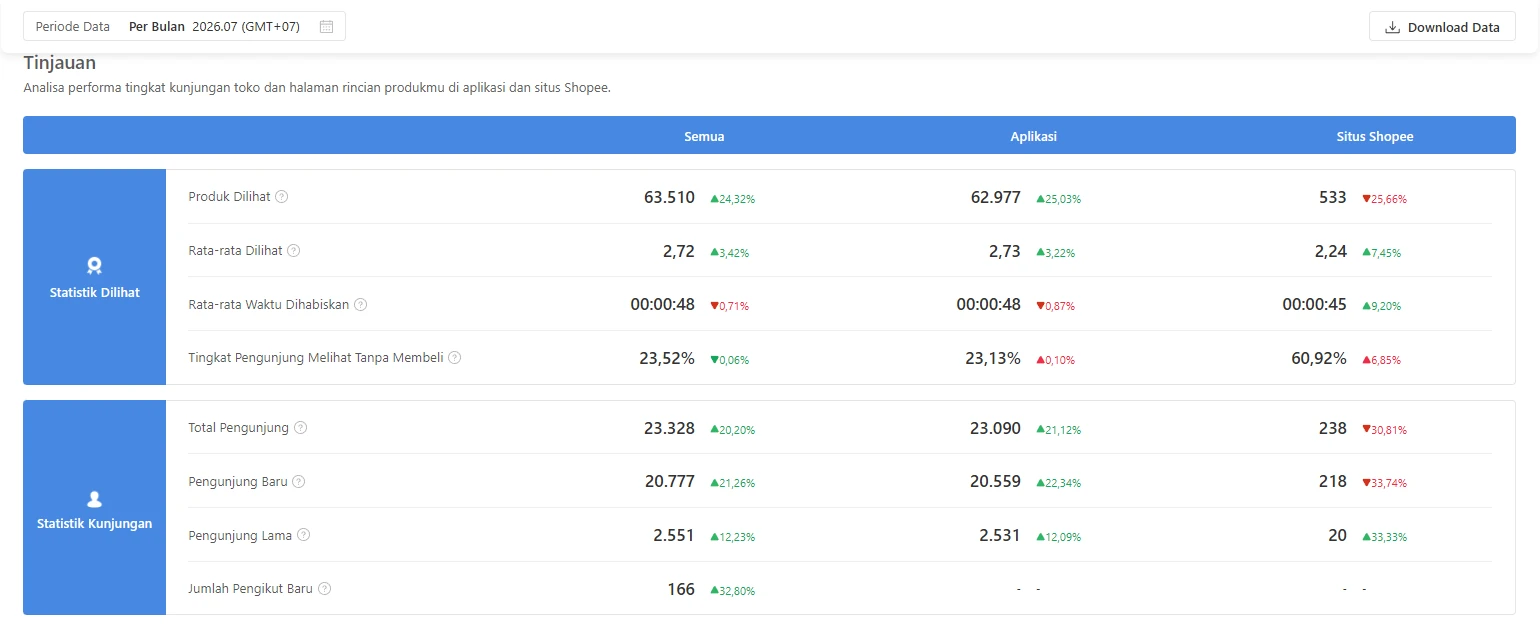
Visitors a month went from 8,734 to 23,328.

Many more people reached the store, and most of the growth was people who had not visited before.

BeforeMarch 2026
Screenshot: Before. March 2026. Performa Toko, Tingkat Kunjungan Open the screenshot at its own size

Performa Toko, Tingkat Kunjungan

AfterJuly 2026
Screenshot: After. July 2026. Same screen Open the screenshot at its own size

Same screen

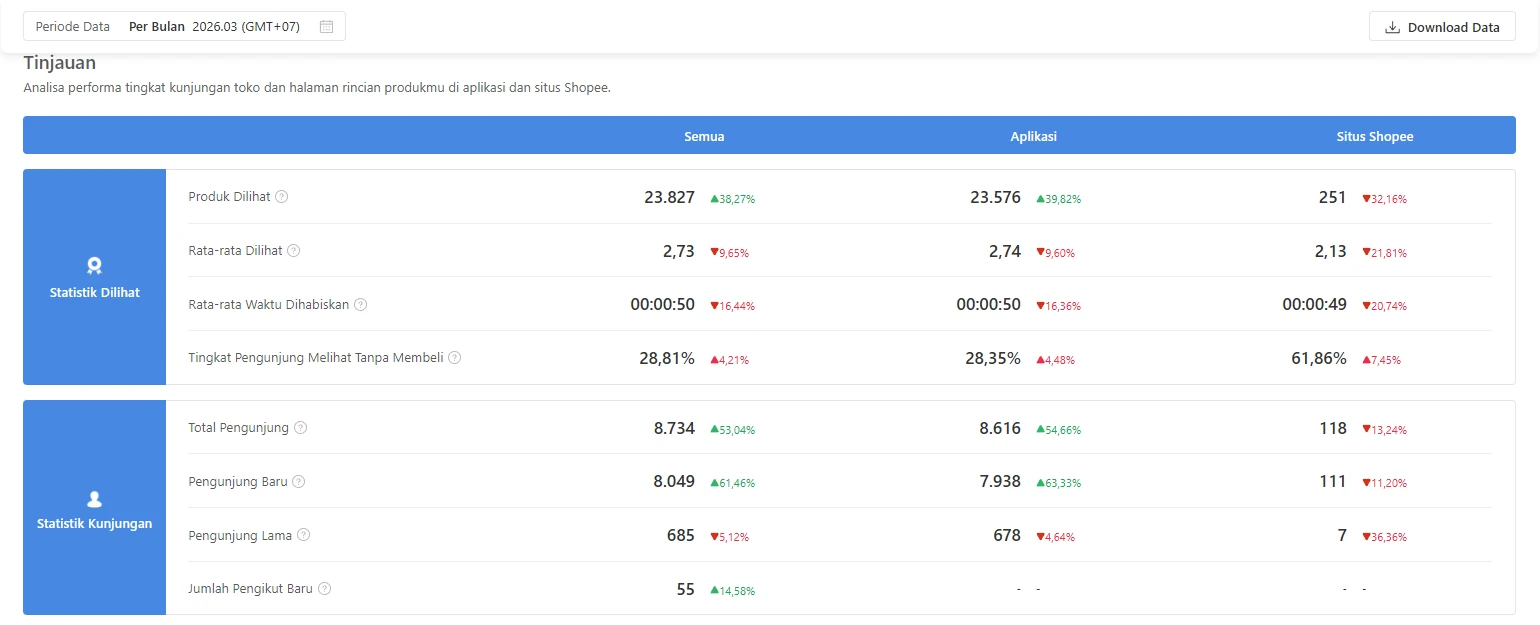
The traffic page counts everyone who reached the store or one of its product pages. In March 2026 that was 8,734 visitors and 23,827 product views. In July it was 23,328 visitors and 63,510 product views.

Most of the growth was new people. Returning visitors grew faster from a small base, from 685 to 2,551.

On the two screens
Mar 2026Jul 2026
Visitors8,73423,328
Product views23,82763,510
New visitors8,04920,777
Returning visitors6852,551

Each screen prints its change against its own month before.

Time stamps on these screens
Per Bulan 2026.03 (GMT+07), 2026.07 (GMT+07)
March and July 2026.
Semua, Aplikasi, Situs Shopee
All traffic, the app, and the website.
00:00:50, 00:00:48
Average time on a page, in hours, minutes, seconds.

The sales funnel, March to July 2026

More visits and more buyers, at a lower conversion rate.

Paid and affiliate traffic brings more people who are less sure, so a smaller share of visits ended in an order while each buyer spent more.

BeforeMarch 2026
Screenshot: Before. March 2026. Performa Toko, Penjualan, Tinjauan Penjualan Open the screenshot at its own size

Performa Toko, Penjualan, Tinjauan Penjualan

AfterJuly 2026
Screenshot: After. July 2026. Same screen Open the screenshot at its own size

Same screen

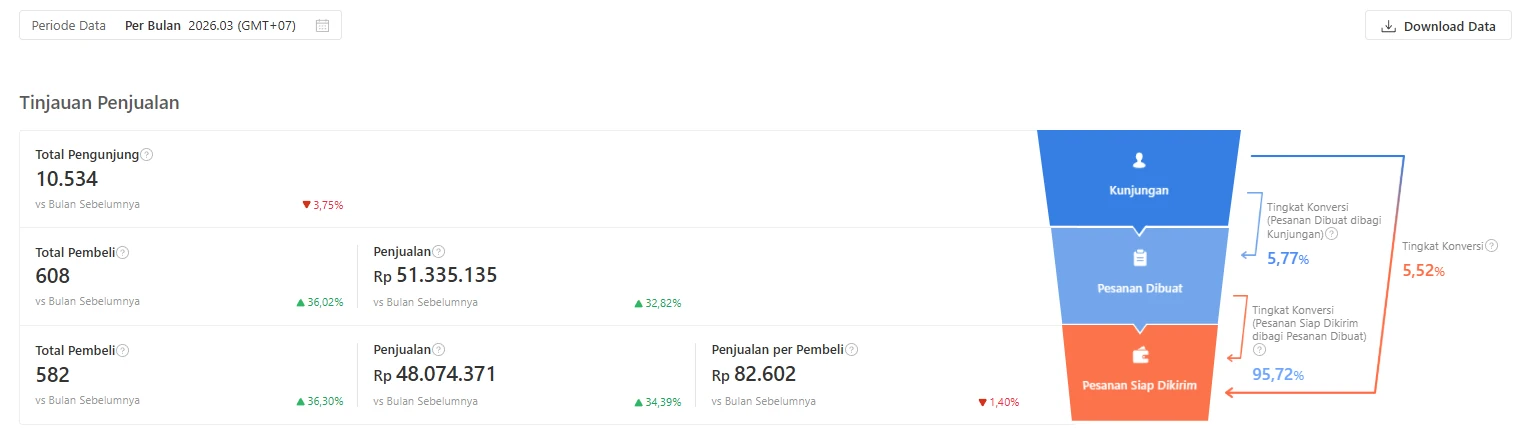
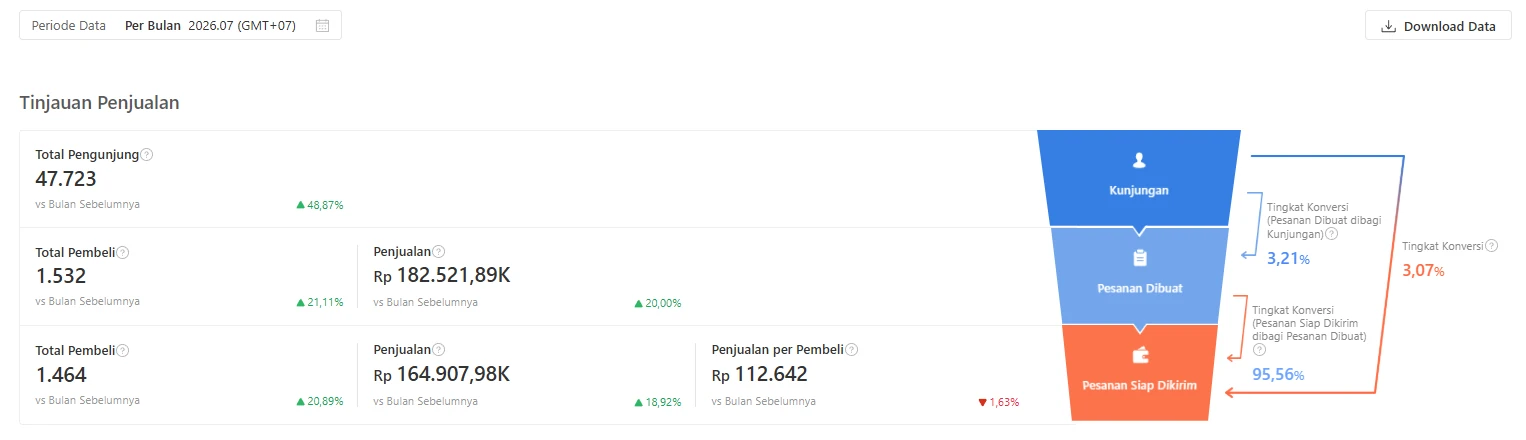
The sales funnel shows what the growth cost in conversion. In March 2026, 10,534 visits produced 608 buyers, 5.77%. In July, 47,723 visits produced 1,532 buyers, 3.21%.

That is what paid and affiliate traffic does: it brings more people who are less sure. Each buyer spent more, IDR 112,642 against IDR 82,602, and 95.56% of orders created reached ready to ship.

On the two screens
Mar 2026Jul 2026
Visits10,53447,723
Buyers, orders created6081,532
Visit to order5.77%3.21%
Sales for each buyerIDR 82,602IDR 112,642

This page counts visitors differently from the traffic page, so the two figures are not the same measure.

Time stamps on these screens
Per Bulan 2026.03 (GMT+07), 2026.07 (GMT+07)
March and July 2026.
Pesanan Dibuat, Pesanan Siap Dikirim
Orders created, then orders ready to ship.
vs Bulan Sebelumnya
Against the month before.

TikTok Shop, March to September 2026

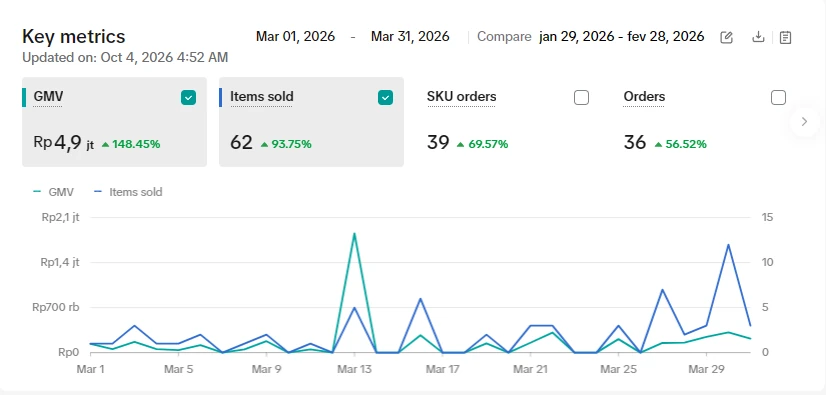
TikTok Shop: IDR 4.9 million to IDR 22.7 million at the May peak.

Sales led by creators rise fast and fall fast, and these three months on TikTok Shop show both.

BeforeMarch 2026
Screenshot: Before. March 2026. TikTok Shop Seller Center, Analytics Open the screenshot at its own size

TikTok Shop Seller Center, Analytics

The peakMay 2026
Screenshot: The peak. May 2026. Same screen Open the screenshot at its own size

Same screen

SinceSeptember 2026
Screenshot: Since. September 2026. Same screen Open the screenshot at its own size

Same screen

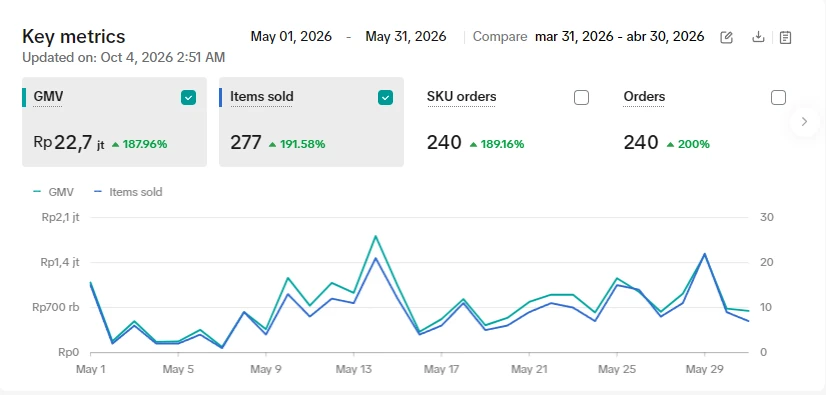
The same product was sold on TikTok Shop through creator videos and product ads. Sales there went from IDR 4.9 million and 36 orders in March 2026 to IDR 22.7 million and 240 orders in May.

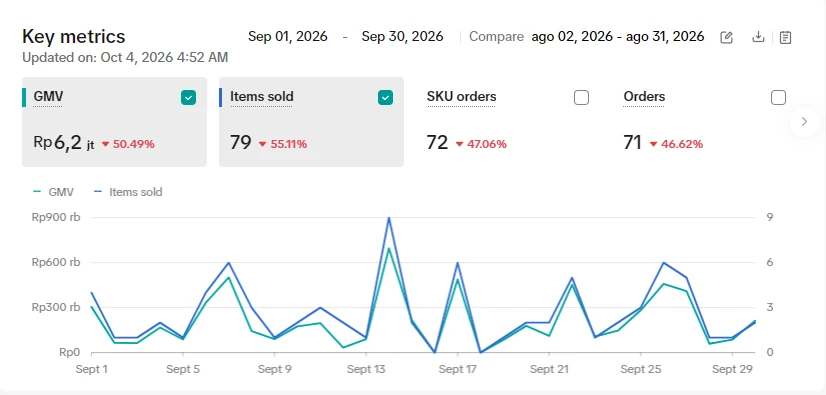
By September the same page read IDR 6.2 million, down 50.49% on the 30 days before, from 71 orders. Creator led sales rise fast and fall fast, which is why we rebuilt the affiliate work in September. It is set out below, after the result.

On the three screens
MarMaySep
Sales, IDR million4.922.76.2
Items sold6227779
Orders3624071
Time stamps on these screens
Mar 01, 2026 - Mar 31, 2026
March 2026. The other two captures read May and September 2026.
Compare
The period each is measured against. fev, abr and ago are how this account prints February, April and August.
Updated on: Oct 4, 2026
When TikTok last refreshed the page.
Rp4,9 jt
jt is juta, million.

Tokopedia, March to September 2026

Tokopedia: IDR 13.5 million to IDR 16.7 million from March to May.

The marketplace that took no part in the creator push rose less and fell less, and it sits in the same report so that no channel is judged alone.

BeforeMarch 2026
Screenshot: Before. March 2026. Tokopedia seller analytics, key metrics Open the screenshot at its own size

Tokopedia seller analytics, key metrics

AfterMay 2026
Screenshot: After. May 2026. Same screen Open the screenshot at its own size

Same screen

SinceSeptember 2026
Screenshot: Since. September 2026. Same screen Open the screenshot at its own size

Same screen

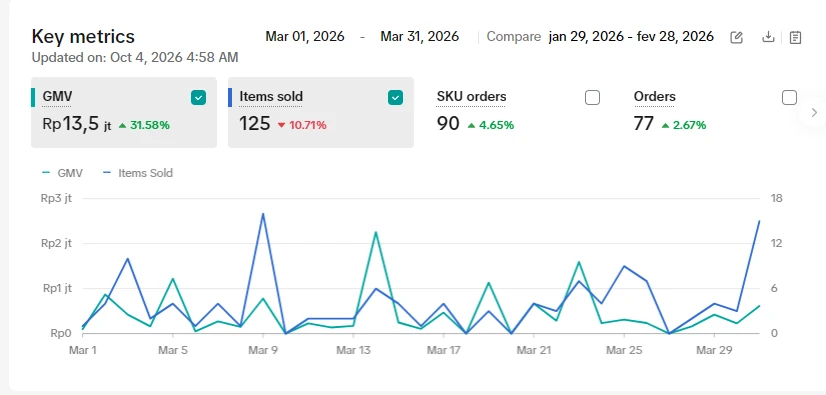
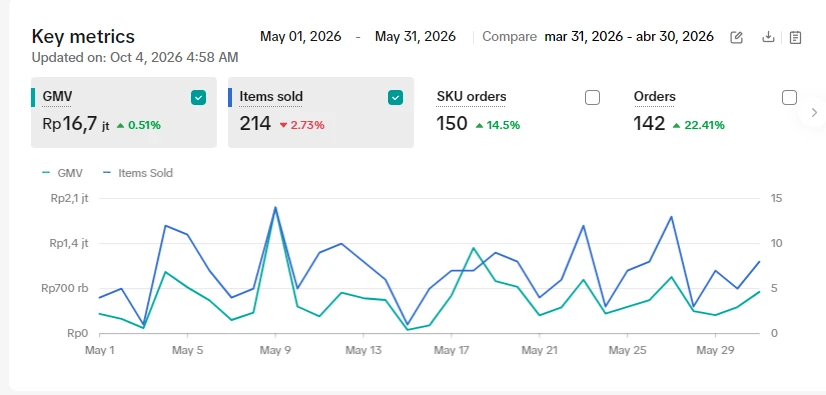
The third marketplace, on the same three months. Tokopedia sold IDR 13.5 million from 77 orders in March 2026 and IDR 16.7 million from 142 orders in May.

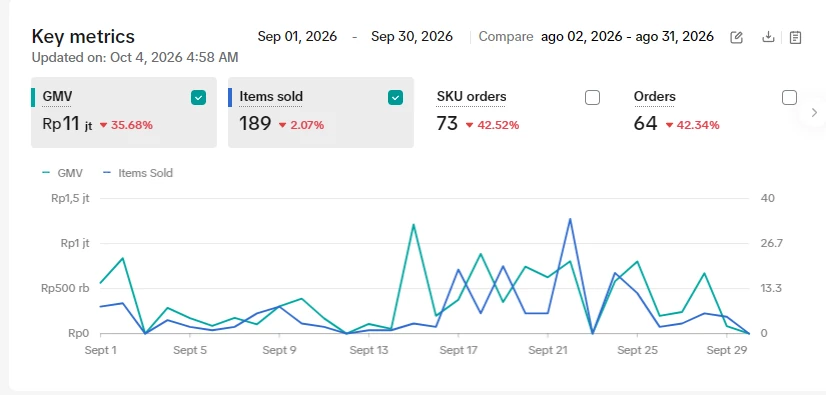
September read IDR 11 million from 64 orders. Tokopedia took no part in the creator push, so it rose less and fell less. It sits in the same monthly report so that no channel is judged alone.

On the three screens
MarMaySep
Sales, IDR million13.516.711
Items sold125214189
Orders7714264
Time stamps on these screens
Mar 01, 2026 - Mar 31, 2026
March 2026. The other two captures read May and September 2026.
Compare
The period each is measured against, printed beside the dates.
Updated on: Oct 4, 2026
When the page was last refreshed.
Rp13,5 jt
jt is juta, million.

The result

IDR 43.33 million a month to IDR 158.56 million, in four months.

July 2026

On the same screen with the same filters, sales grew faster than orders, while the share of visitors who ordered fell and cancelled orders rose.

BeforeMarch 2026
Screenshot: Before. March 2026. Shopee Seller Centre, Performa Toko, Tinjauan Open the screenshot at its own size

Shopee Seller Centre, Performa Toko, Tinjauan

AfterJuly 2026
Screenshot: After. July 2026. Same screen, same filters Open the screenshot at its own size

Same screen, same filters

July 2026 closed at IDR 158.56 million from 1,532 orders, against IDR 43.33 million and 556 orders in March. Sales grew faster than orders: the average order went from about IDR 77,900 to about IDR 103,500.

Two things on the same screen moved the other way. Order conversion fell from 3.74% to 2.50%, and cancelled orders rose with the volume, from 17 to 49.

Before and after
Mar 2026Jul 2026Change
Sales a monthIDR 43.33 millionIDR 158.56 million3.7 times
Orders a month5561,5322.8 times
Average orderabout IDR 77,900about IDR 103,5001.3 times
Order conversion3.74%2.50%down 1.24 points

The change column and the average order are our arithmetic.

Time stamps on these screens
Per Bulan 2026.03 (GMT+07)
March 2026, the month before the audit.
Per Bulan 2026.07 (GMT+07)
July 2026.
Status Pesanan: Pesanan Dibayar
Paid orders only, on both screens.
Rp 158.559,20K
K is thousand: IDR 158,559,200.

After the peak

After the peak, still above the target: IDR 126.62 million, then IDR 109.97 million.

August and September 2026

Sales came down from the July high for two months, and both months still closed above the target.

After the peakAugust 2026
Screenshot: After the peak. August 2026. Same screen Open the screenshot at its own size

Same screen

After the peakSeptember 2026
Screenshot: After the peak. September 2026. Same screen Open the screenshot at its own size

Same screen

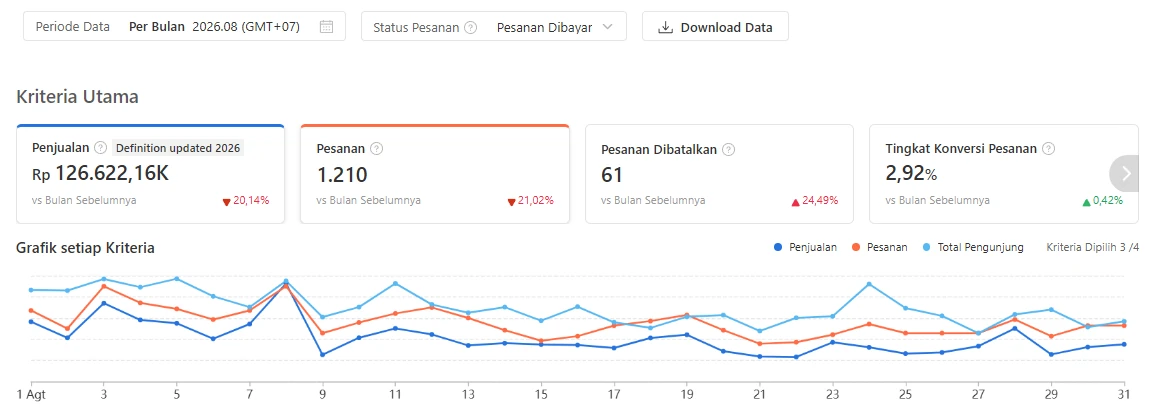
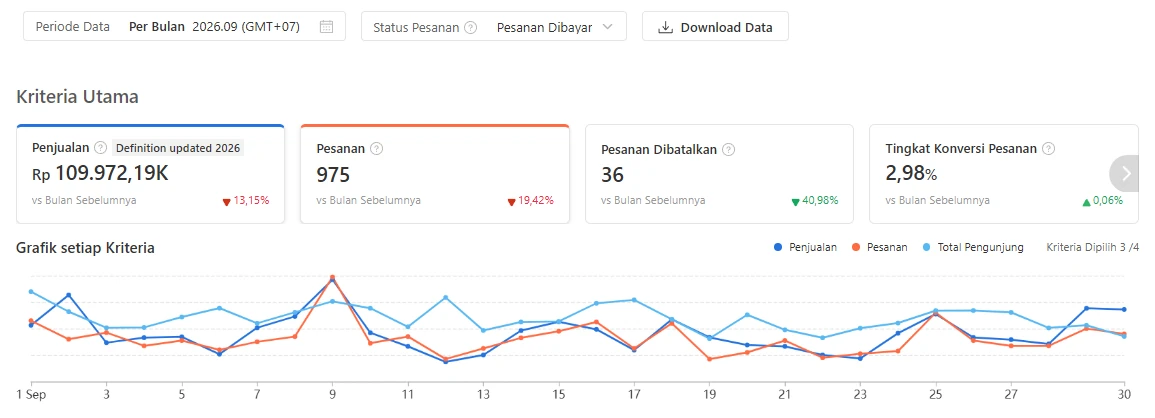
July was the high point. August closed at IDR 126.62 million, down 20.14%, and September at IDR 109.97 million, down 13.15%. Both months stand above the target of IDR 100 million, and by our arithmetic September is 2.5 times the sales of March.

We answer for the months after a peak as much as for the peak, so here they are. The next two sections show what slowed and what we changed.

On the two screens
Aug 2026Sep 2026
Sales, IDR million126.62down 20.14%109.97down 13.15%
Orders1,210down 21.02%975down 19.42%
Cancelled orders61up 24.49%36down 40.98%
Order conversion2.92%up 0.42%2.98%up 0.06%

Changes against the month before, as Shopee shows them.

Time stamps on these screens
Per Bulan 2026.08 (GMT+07), 2026.09 (GMT+07)
August and September 2026, paid orders.
1 Agt
The chart axis. Agt is Agustus, August.
Rp 109.972,19K
K is thousand: IDR 109,972,190.

Affiliates, July to September 2026

What slowed was the affiliate channel, so we rewrote how it runs.

A channel that runs on new videos slows when the samples stop, and no samples went out in August.

The peakJuly 2026
Screenshot: The peak. July 2026. Affiliate Marketing Solution, Metrik Utama Open the screenshot at its own size

Affiliate Marketing Solution, Metrik Utama

Two months laterSeptember 2026
Screenshot: Two months later. September 2026. Same screen Open the screenshot at its own size

Same screen

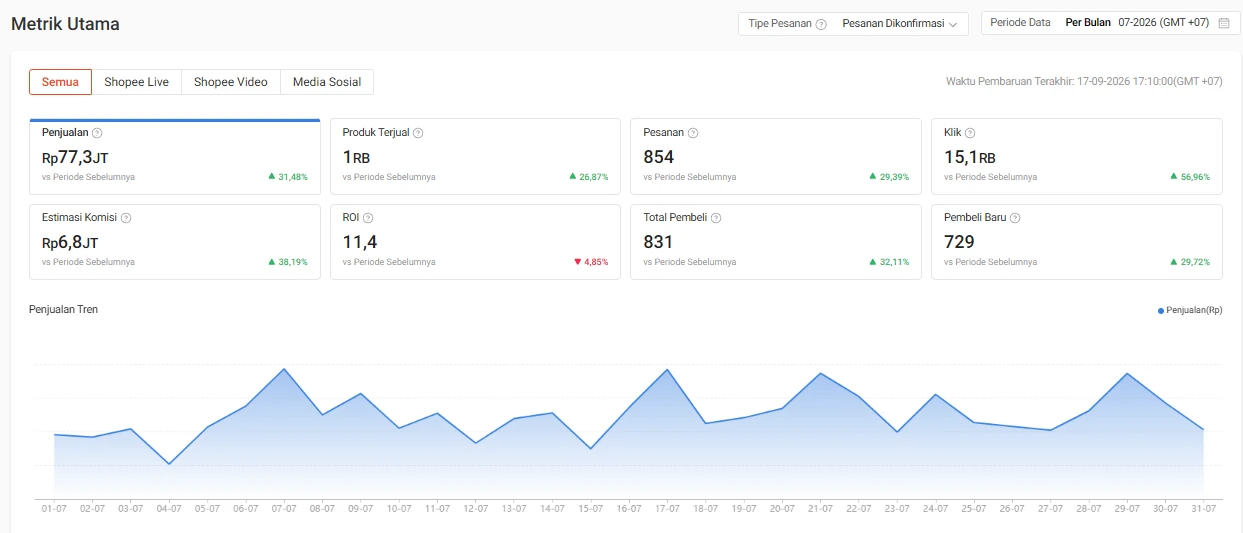
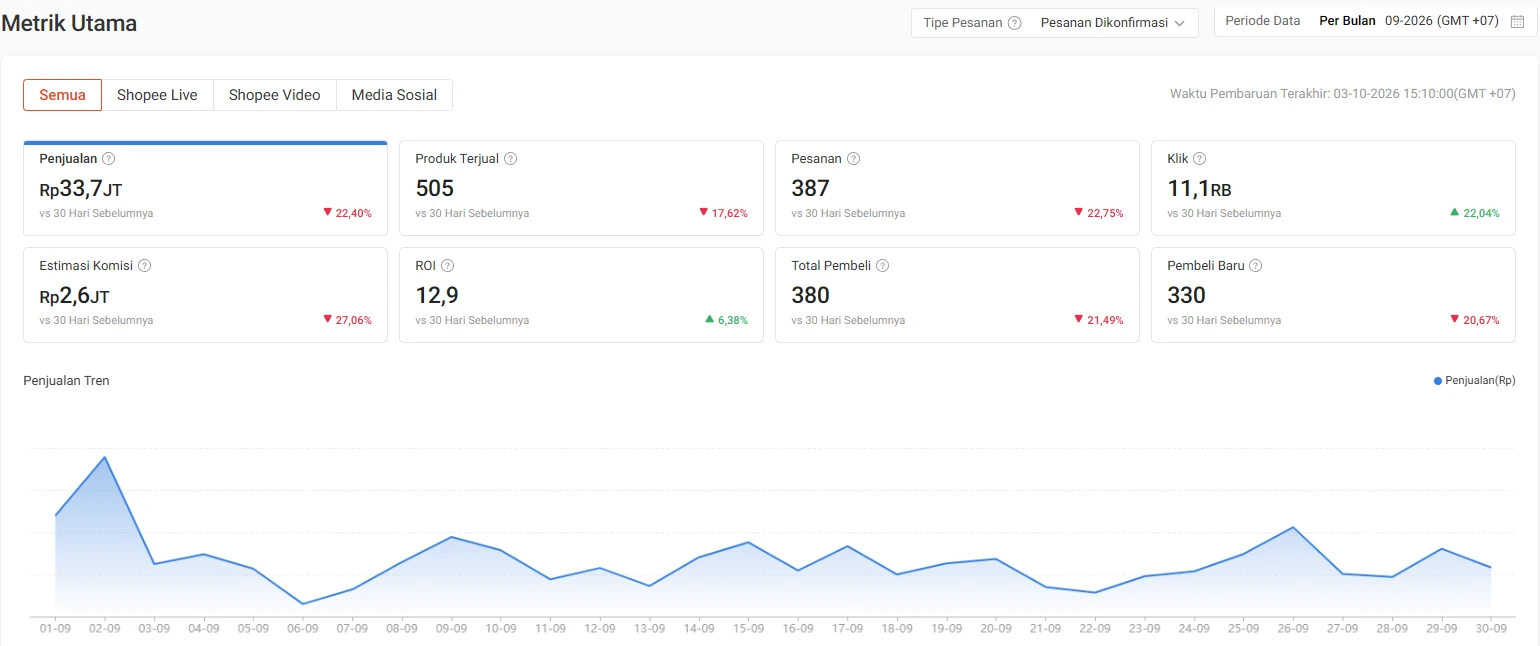
The affiliate page shows what slowed. Creators brought IDR 77.3 million from 854 orders in July 2026 and IDR 33.7 million from 387 orders in September.

No samples went out to creators in August. A channel that runs on new videos slows when the samples stop, so we rewrote the procedure: no creator now waits on an approval before the first message. It is in the next section.

On the two screens
Jul 2026Sep 2026
Affiliate salesIDR 77.3 millionIDR 33.7 million
Orders854387
Clicks15.1 thousand11.1 thousand
New buyers729330

The affiliate page is a different count from the live and video card of the overview: confirmed orders, every affiliate type.

Time stamps on these screens
Per Bulan 07-2026 (GMT +07), 09-2026 (GMT +07)
July and September 2026, confirmed orders.
Waktu Pembaruan Terakhir
Last data refresh: 17 September and 3 October 2026.
Rp77,3JT, 15,1RB
JT is juta, million. RB is ribu, thousand.

The affiliate procedure of 14 September 2026

The affiliate work, rebuilt to run every working day.

Written for the team member who runs it, so that the work does not depend on memory, and no creator waits on an approval before the first message.

  • Find

    Four creators researched a day on each platform. At least one a day comes from watching who tags rival products in their videos.

  • Check

    Skipped: under 1,000 followers, thin views, or 60 days without a post. The rest are scored out of 100, led by fit, engagement and views.

  • Write

    The message names one video of the creator. One follow up on day 3, and never a third message.

  • Sample and report

    One sample for each creator, once the product is in the showcase and a post is agreed within 7 days. A report every Friday.

It is dated 14 September 2026 and replaced the version of 8 September.

Two rules carry most of it. A sample is an investment, not a gift: it goes only to a creator who has already listed the product. And 3,000 followers with 500 views beat 50,000 followers with 100 views.

Commission rises in steps with what a creator has sold, and is never cut.

The targets it sets for each week

Researched
40 creators.
Written to
25 creators, each with a message about their own video.
Replies
One in five, or better.
Agreed to join
Five or more.

Targets set by the procedure of 14 September.

The longer view

Against April 2025, 11.8 times the monthly sales.

April 2025 to July 2026

Over fifteen months instead of four the climb is longer, and the four months of this case are its steepest part.

Fifteen months earlierApril 2025
Screenshot: Fifteen months earlier. April 2025. Shopee Seller Centre, Performa Toko, Tinjauan Open the screenshot at its own size

Shopee Seller Centre, Performa Toko, Tinjauan

AfterJuly 2026
Screenshot: After. July 2026. Same screen Open the screenshot at its own size

Same screen

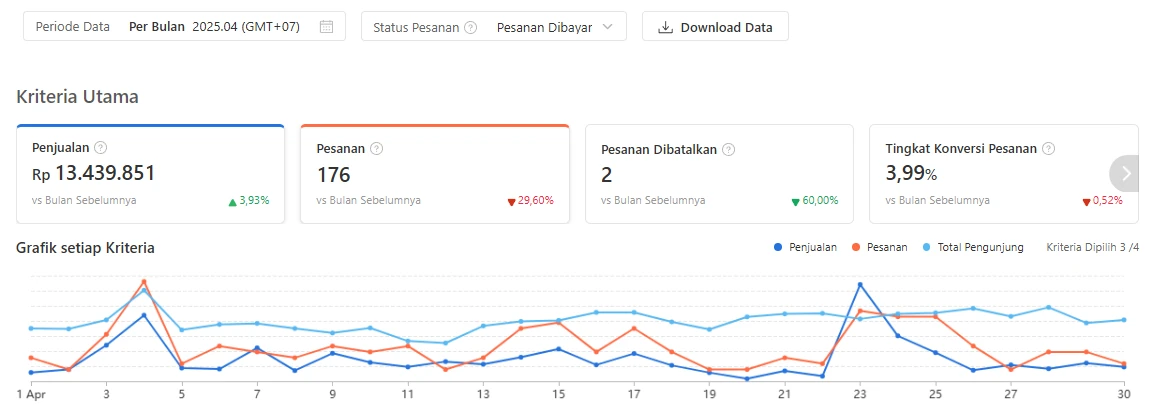
The same screen, fifteen months apart. April 2025 closed at IDR 13.44 million from 176 orders. July 2026 closed at IDR 158.56 million from 1,532 orders: 11.8 times the sales and 8.7 times the orders.

The four months from March to July 2026 are the steepest part of that climb. Shopee changed its definition of sales in 2026, so the two months are close, not identical, measures.

Fifteen months apart
Apr 2025Jul 2026Change
Sales a monthIDR 13.44 millionIDR 158.56 million11.8 times
Orders a month1761,5328.7 times
Order conversion3.99%2.50%down 1.49 points

The change column is our arithmetic.

Time stamps on these screens
Per Bulan 2025.04 (GMT+07)
April 2025.
Per Bulan 2026.07 (GMT+07)
July 2026.
Definition updated 2026
On the 2026 screen only: Shopee changed how it counts sales.
Status Pesanan: Pesanan Dibayar
Paid orders on both screens.

2025 and 2026 to date

Nine months of 2026: 3.2 times the sales of the whole of 2025.

The yearly screen shows the same growth at the scale of a year, and it needs one caution about the percentage printed for 2025.

2025The whole year
Screenshot: 2025. The whole year. Performa Toko, Tinjauan, by year Open the screenshot at its own size

Performa Toko, Tinjauan, by year

2026 to dateJanuary to September
Screenshot: 2026 to date. January to September. Same screen Open the screenshot at its own size

Same screen

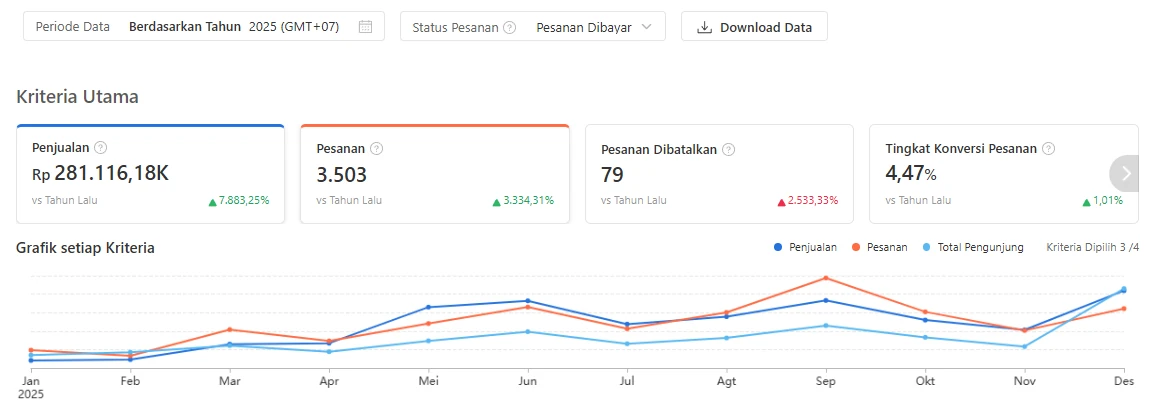
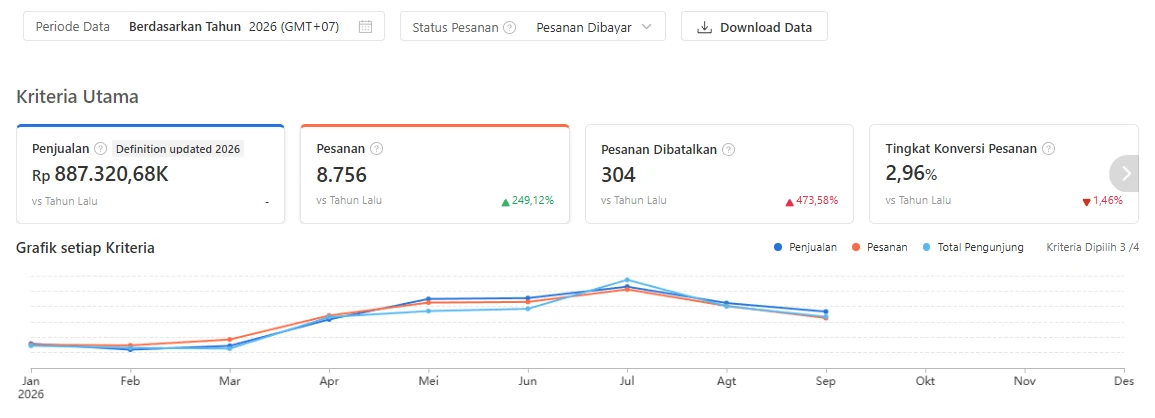
The yearly view of the same page. The whole of 2025 sold IDR 281.12 million from 3,503 orders. 2026 had sold IDR 887.32 million from 8,756 orders by the end of September.

The 2025 screen prints a rise of several thousand percent on the year before, because the store took its first order late in 2024: that figure compares a full year with the last three months of 2024.

Year against year
20252026 to SepChange
SalesIDR 281.12 millionIDR 887.32 million3.2 times
Orders3,5038,7562.5 times
Order conversion4.47%2.96%down 1.51 points

The 2026 column is year to date. The change column is our arithmetic.

Time stamps on these screens
Berdasarkan Tahun 2025 (GMT+07)
The whole of 2025.
Berdasarkan Tahun 2026 (GMT+07)
2026 so far, captured on 4 October. By our sum of the monthly screens it covers January to September.
vs Tahun Lalu
Against the year before. For 2026 that is the same months of 2025.
Rp 887.320,68K
K is thousand: IDR 887,320,680.

What would we change in your store?

Tell us about your store in a free consultation and we will tell you where we would start. If you want the detail first, the Full Store Diagnosis costs USD 20IDR 300.000 per store and takes 3 business days from payment and data.