Skip to content

Case studiesCase 04, Frozen food brand

A neglected Shopee shop, from SGD 1,556 a month to SGD 12,975.

Sales a month8.3 times

BeforeApril 2026

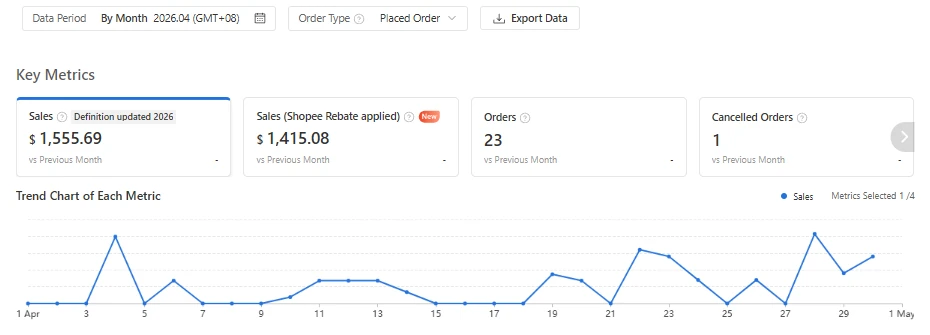
SGD1,555.69

AfterAugust 2026

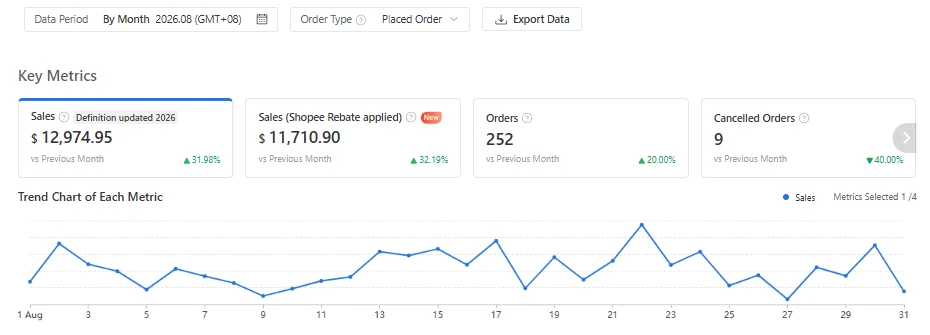
SGD12,974.95

A frozen food brand in Singapore whose Shopee shop had barely been worked. April 2026 is the month we audited. Work began in May, on a plan that put the listings first, with the ad budget raised in steps. This is what the screens said, month by month, to August. The store stays unnamed. The figures are the ones on its screens.

  • Frozen food
  • Shopee
  • Singapore
  • Apr to Aug 2026
AfterAugust 2026
Screenshot: After. August 2026. Shopee Seller Centre, Business Insights, Overview Open the screenshot at its own size

Shopee Seller Centre, Business Insights, Overview

Orders a month
252
August 2026. From 23 in April 2026.
11 times
Visitors who bought
4.32%
232 buyers from 5,370 visitors. August 2026. 1.93% in our audit of April.
Ad spend a month
SGD 1,000.00
August 2026. SGD 100.00 in April, SGD 192.42 in May, SGD 571.92 in July.
Raised in steps

From the Shopee Seller Centre of the store, orders placed. The multiples are our arithmetic. The April share of visitors who bought is from our audit.

In short

  1. The problem

    In April 2026 the shop took 23 orders worth SGD 1,555.69, and on about half the days it sold nothing. Shoppers found the products and then left.

  2. What we changed

    We put the listings first: 17 were rewritten, with no ad spend in week one. The ads came back on about 9 May, and the budget rose in steps to SGD 1,000.00 in August, only on the campaigns that paid back.

  3. The result

    August 2026 closed at SGD 12,974.95 from 252 orders, 8.3 times the sales of April. That month 4.32% of visitors bought, against 1.93% in our audit of April.

The problem

SGD 1,555.69 in a month, with ads on for seven days of thirty.

April 2026

This is the starting point, before any of our work: a shop that had no sale on about half the days of the month.

  • BeforeApril 2026: sales of SGD 1,555.69 a month, the month before our work.
  • AfterAugust 2026: sales of SGD 12,974.95 a month.
BeforeApril 2026
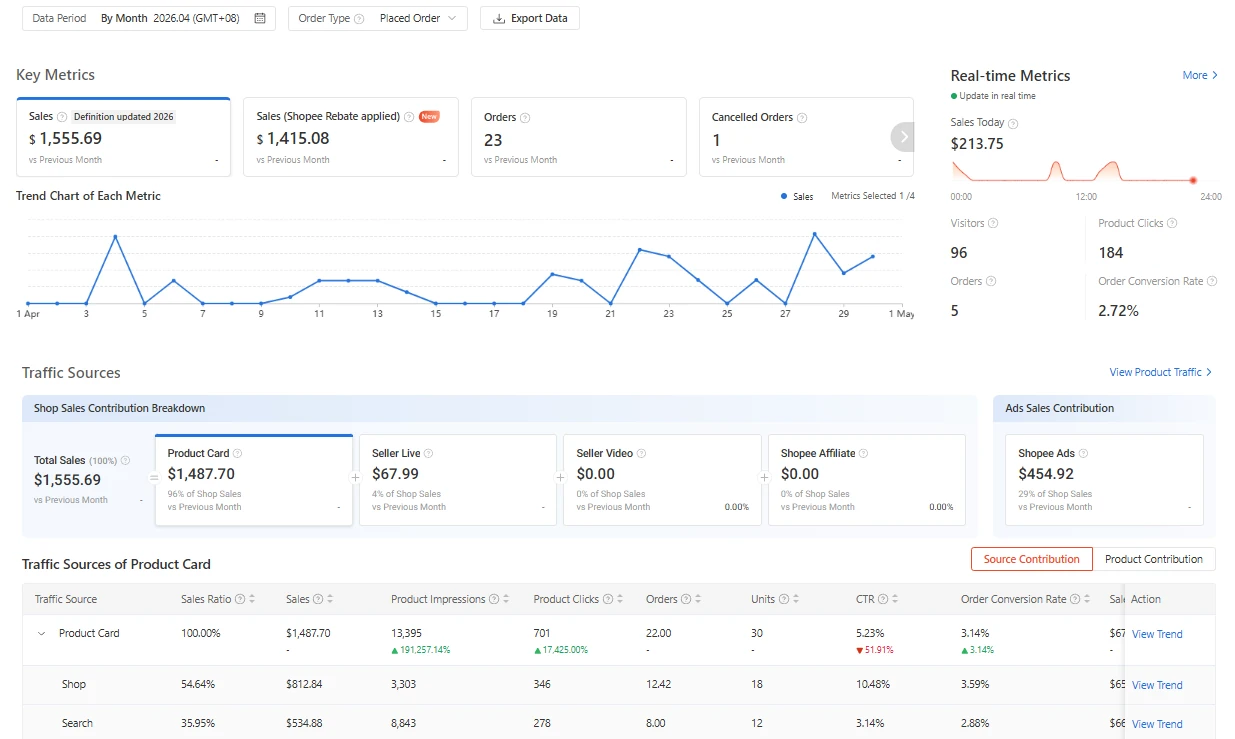
Screenshot: Before. April 2026. Shopee Seller Centre, Business Insights, Overview Open the screenshot at its own size

Shopee Seller Centre, Business Insights, Overview

April 2026 is the month before our work. The Shopee shop took 23 orders worth SGD 1,555.69, and the sales line sat on zero for about half the month.

Our audit covered 2 April to 1 May. Ads had run for seven days and then stopped, and most days without a sale were days without ads. One bundle made 64% of sales. Shoppers clicked at a healthy rate and then left: most products had no more than two reviews.

In the audit, 2 April to 1 May 2026

Days with ads
7 of 30
Days with no sale
13 of 30
Sales from one bundle
64%
Clicks on products, and orders
775 clicks, 24 orders
Reviews on each product
0 to 2
Buyers who had bought before
None of 23

From our audit of the Seller Centre exports. Not on the screen.

Time stamps on these screens
Data Period: By Month 2026.04 (GMT+08)
April 2026, Singapore time.
Order Type: Placed Order
Orders placed, before cancellations. The result below uses the same filter.
vs Previous Month shows a dash
These tiles print no comparison with March.
1 Apr to 1 May
The chart axis. On a 30 day month the last tick is the first day of the next month.
What we changed

Fix the page first, then pay for the traffic.

The audit said shoppers found the products and then left. So the plan put the page first: week one on the listings with no ad spend. The ads came back on about 9 May, and the budget rose only as the return held.

  • 17 listings rewritten

    Listings rewritten on the words shoppers type into Shopee search, with a new shop banner and new main product images.

  • Budget on the two best ads

    In May the ad budget moved to the two campaigns with the highest return. By July four product campaigns were running.

  • Campaigns and vouchers

    The shop was enrolled in two Shopee campaigns, and the platform voucher and the delivery options were set up.

  • A violation cleared

    A listing violation was found and resolved, which kept the products visible.

The order was deliberate. Paying for clicks onto a page that does not convert only buys a larger leak, so the plan put the page first.

Chat, packing and delivery stayed with the client throughout. We ran the listings, the ads, the promotions and the reporting.

What was done, and when

  1. About 2 May 2026Audit of 2 April to 1 May delivered, with a plan for month one.
  2. May17 listings rewritten. Shop banner and main images replaced. A listing violation resolved.
  3. About 9 MayAds restarted. During May the budget moved to the two campaigns that returned most.
  4. 23 and 31 MayTwo Shopee campaigns joined, the first running 23 May to 24 June, the second 31 May to 30 June. Platform voucher and delivery options set up in May.
  5. About 5 JuneMay report to the owner: sales, fees, refunds and account health.
  6. About 1 JulyJune report, with a product ranking and a competitor price check.
  7. About 13 AugustThree month review.

Dates marked about are the dates of our files. 9 May is read from the ads chart.

The first two months, May and June 2026

May closed at SGD 1,915.60, June at SGD 4,808.51.

In the first two months of our work, sales rose in May and much faster in June, and the first sales through affiliates appeared.

Month oneMay 2026
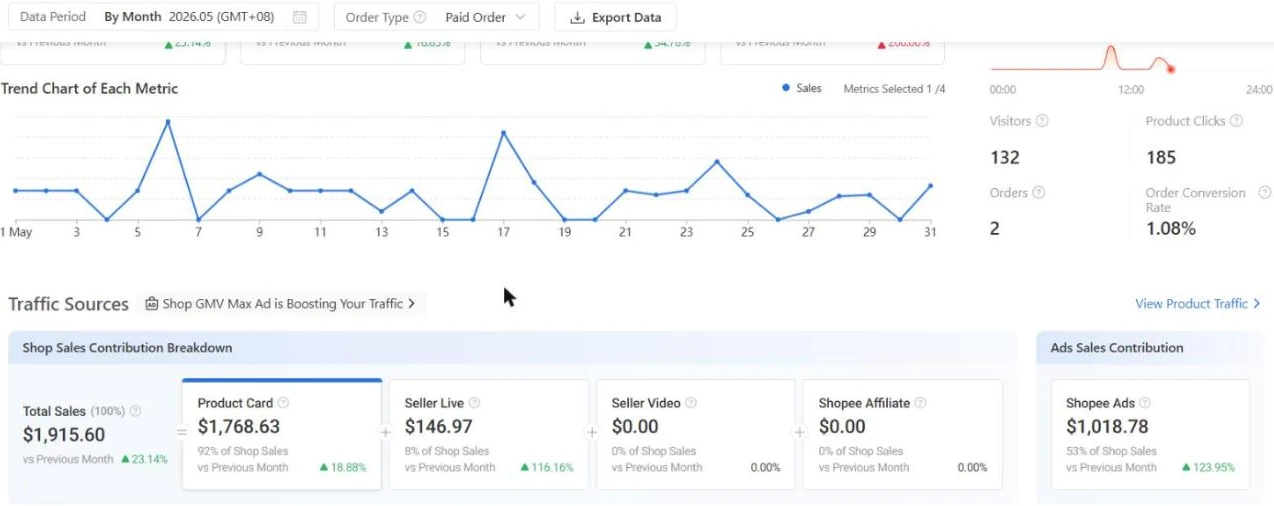
Screenshot: Month one. May 2026. Business Insights, Overview, scrolled to Traffic Sources Open the screenshot at its own size

Business Insights, Overview, scrolled to Traffic Sources

Month twoJune 2026
Screenshot: Month two. June 2026. Same screen Open the screenshot at its own size

Same screen

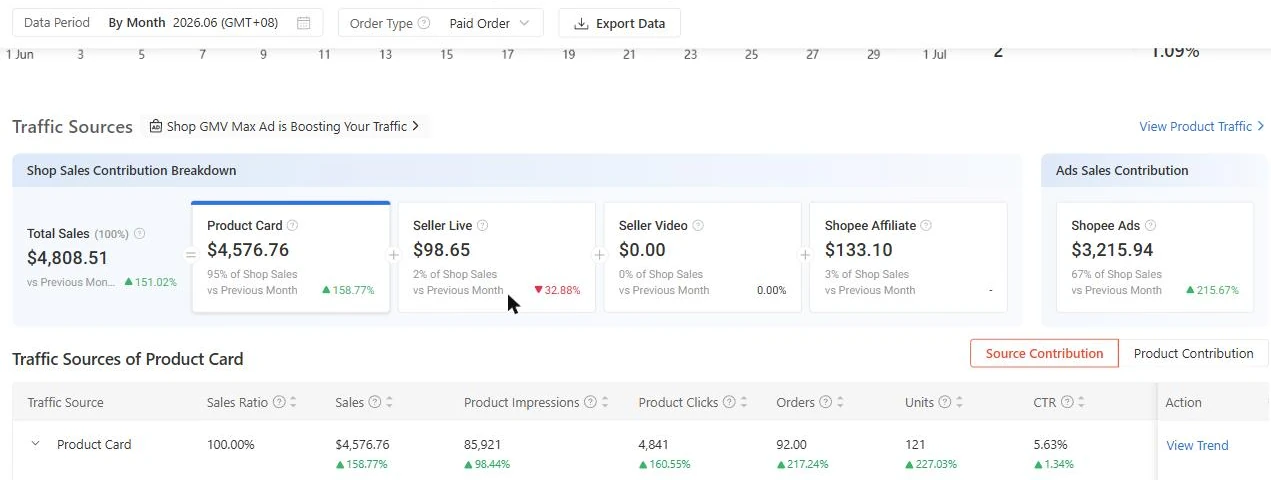
The first two months of work, on paid orders. May 2026 closed at SGD 1,915.60, up 23.14% on April, with SGD 1,018.78 of it touched by ads. June closed at SGD 4,808.51, up 151.02%, with SGD 3,215.94 touched by ads.

Affiliate sales appear for the first time in June, at SGD 133.10, 3% of sales.

On the two screens
May 2026Jun 2026
Total salesSGD 1,915.60up 23.14%SGD 4,808.51up 151.02%
Product cardsSGD 1,768.63up 18.88%SGD 4,576.76up 158.77%
Sales touched by adsSGD 1,018.78up 123.95%SGD 3,215.94up 215.67%

Changes against the month before, as Shopee shows them.

Time stamps on these screens
Data Period: By Month 2026.05 (GMT+08), 2026.06 (GMT+08)
May and June 2026.
Order Type: Paid Order
Paid orders here. The April and August screens use orders placed.
Scrolled captures
The pages were scrolled, so the top tiles are hidden under the period bar. On the May capture their lower edge still shows. A mouse pointer is visible.
Visitors 132, Orders 2
On the May capture, the small panel on the right shows the day of capture, not the month.

Shopee Ads, April to August 2026

Ad sales: SGD 454.92 in April, SGD 10,152.60 in August.

These two screens are the advertising alone: what the shop spent on Shopee Ads in each month, and the sales and orders those ads brought.

BeforeApril 2026
Screenshot: Before. April 2026. Shopee Ads, Performance Open the screenshot at its own size

Shopee Ads, Performance

AfterAugust 2026
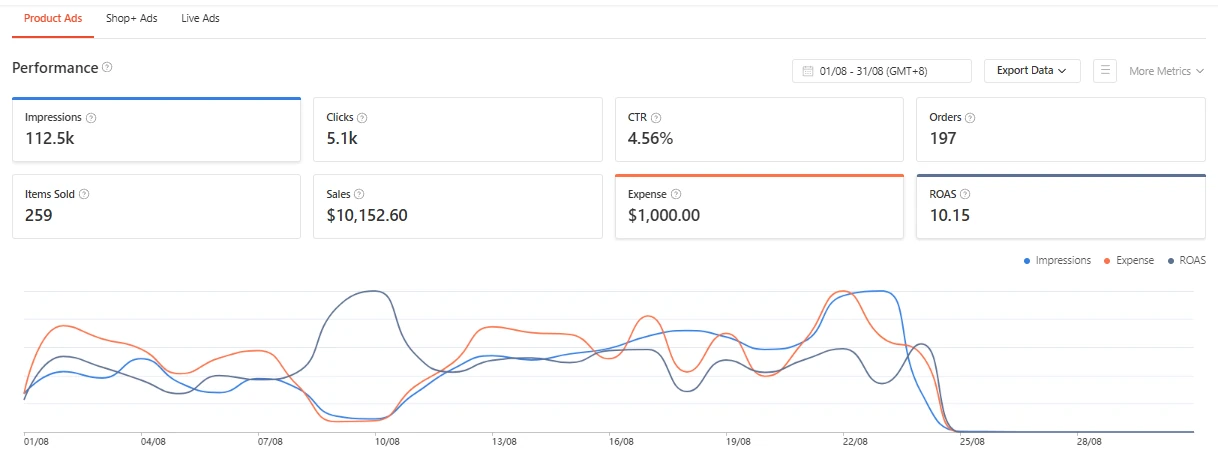
Screenshot: After. August 2026. Shopee Ads, Product Ads, Performance Open the screenshot at its own size

Shopee Ads, Product Ads, Performance

April shows the advertising of the month before our work: SGD 100.00 of spend, SGD 454.92 of sales and 6 orders. Our audit found it was one campaign that ran for seven days.

August shows it run every day to about 24 August: SGD 1,000.00 of spend, SGD 10,152.60 of sales and 197 orders. The click rate rose from 2.74% to 4.56%.

On the two screens
Apr 2026Aug 2026
Ad salesSGD 454.92SGD 10,152.60
Ad spendSGD 100.00SGD 1,000.00
Orders6197
Clicks1905.1 thousand
Click rate2.74%4.56%
Time stamps on these screens
01/04 - 30/04 (GMT+8)
April. Shopee Ads prints no year. Spend, sales and clicks match our audit of April 2026.
01/08 - 31/08 (GMT+8)
August 2026.
Expense $1,000.00
The August chart falls to zero after about 24 August. That suggests the budget for the month ran out first.
Mouse pointer
Visible on the April capture. Nothing on it is changed.

Shopee Ads, May and July 2026

The budget rose in steps, and each step had to earn the next.

May and July are the two steps between April and August on the same ads screen: the spend went up, and the sales from the ads went up with it.

Month oneMay 2026
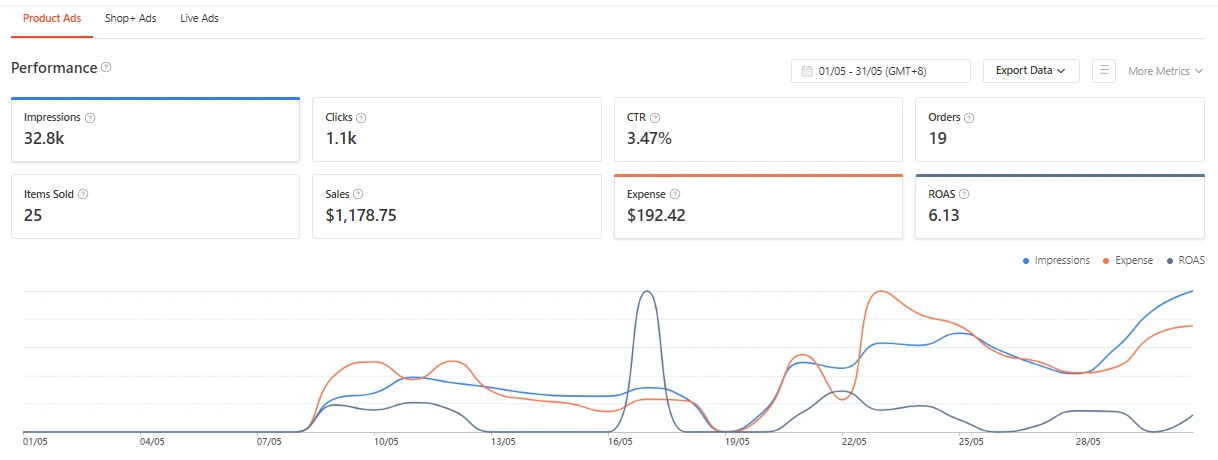
Screenshot: Month one. May 2026. Shopee Ads, Product Ads, Performance Open the screenshot at its own size

Shopee Ads, Product Ads, Performance

Month threeJuly 2026
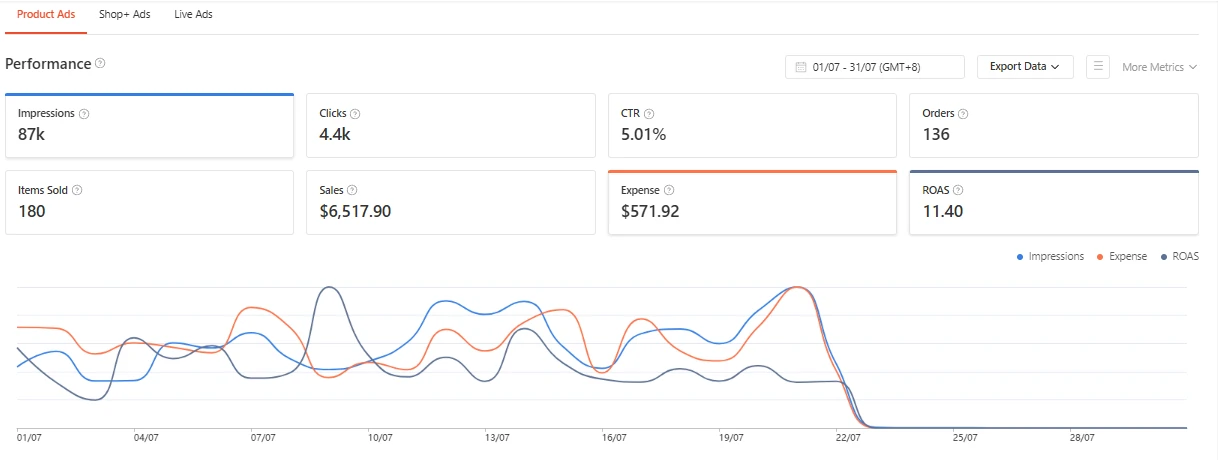
Screenshot: Month three. July 2026. Same screen Open the screenshot at its own size

Same screen

The steps between April and August. May: SGD 192.42 of spend for SGD 1,178.75 of sales and 19 orders. July: SGD 571.92 of spend for SGD 6,517.90 of sales and 136 orders.

The rule was to raise the budget on the campaigns that paid back and to trim or pause the rest. Our three month review lists the four product campaigns of July, with what each one spent and sold.

In our three month review, August 2026

The best selling bundle
SGD 294 spent, SGD 3,285 sold
A one kilo pack
SGD 154 spent, SGD 1,598 sold
A half kilo pack
SGD 109 spent, SGD 1,473 sold
A second bundle
SGD 15 spent, SGD 162 sold

From our three month review for the client. Not on the screens above.

Time stamps on these screens
01/05 - 31/05 (GMT+8), 01/07 - 31/07 (GMT+8)
May and July. No year is printed. Both match our reports for 2026.
Flat line at the start of May
The chart sits at zero until about 9 May, when the ads restarted.
Flat line at the end of July
The chart falls to zero after about 22 July.
Sales $1,178.75 and $6,517.90
Higher than the ads card on the paid order overviews of the same months. In April and August, where the overview is on orders placed, the two agree.

Month three, July 2026

July: SGD 9,496.30 from 204 paid orders, almost double June.

Sales nearly doubled in a month when fewer people visited the shop: the growth came from more visitors buying, not from more visitors.

Month threeJuly 2026
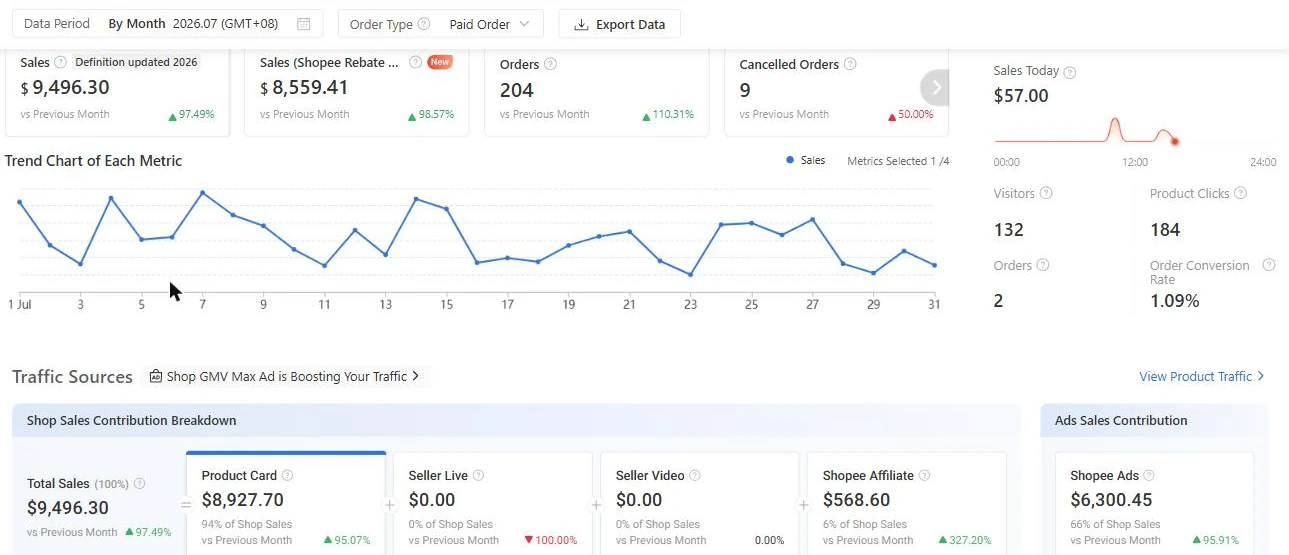
Screenshot: Month three. July 2026. Business Insights, Overview Open the screenshot at its own size

Business Insights, Overview

July on paid orders: SGD 9,496.30, up 97.49% on June, from 204 orders, up 110.31%. Product cards brought SGD 8,927.70, and the ads touched SGD 6,300.45, 66% of sales.

Our review adds what the screen does not show. Visitors fell from 5,688 in June to 4,905 in July while sales nearly doubled, so the gain came from more visitors buying, not from more visitors. 182 of the 192 buyers in July were new to the shop.

In our three month review, August 2026
MayJunJul
Visitors4,4995,6884,905
Product clicks2,3735,1669,854
Buyers3095192
New buyers2793182

From our three month review for the client. It counts clicks across the whole shop. Not on the screen.

Time stamps on these screens
Data Period: By Month 2026.07 (GMT+08)
July 2026.
Order Type: Paid Order
Paid orders.
Sales Today $57.00
The side panel shows the day of capture, not July.
Scrolled capture
The page was scrolled a little when captured. A mouse pointer is visible.

The result

SGD 1,555.69 a month to SGD 12,974.95, in four months.

August 2026

On the same screen with the same filters, four months apart, April had no sale on about half its days and August had sales on every day.

BeforeApril 2026
Screenshot: Before. April 2026. Shopee Seller Centre, Business Insights, Overview Open the screenshot at its own size

Shopee Seller Centre, Business Insights, Overview

AfterAugust 2026
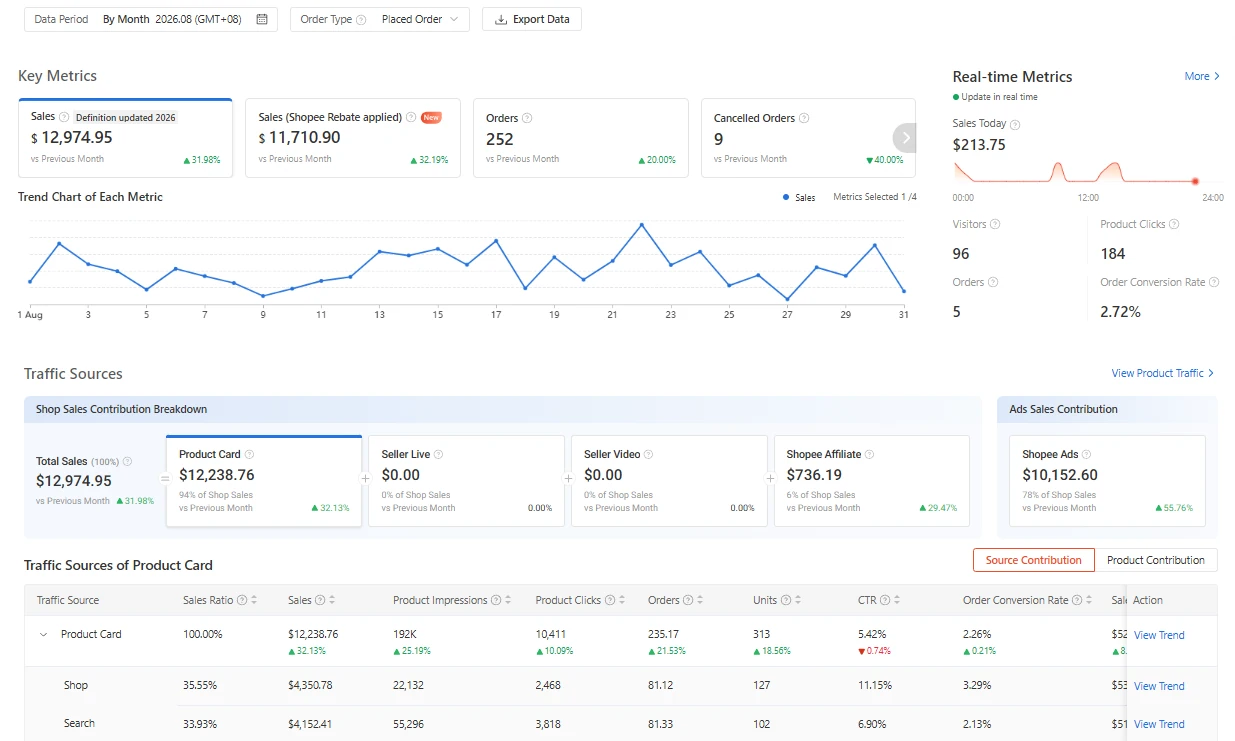
Screenshot: After. August 2026. Same screen, same filters Open the screenshot at its own size

Same screen, same filters

August 2026 closed at SGD 12,974.95 from 252 orders placed, against SGD 1,555.69 and 23 orders in April. Every day of August had sales. In April about half the days had none.

Orders grew faster than sales: the average order went from about SGD 68 to about SGD 51. Our review of May to July puts the smaller basket down to a smaller pack that became the way in for new buyers.

Before and after
Apr 2026Aug 2026Change
Sales a monthSGD 1,555.69SGD 12,974.958.3 times
Orders a month2325211 times
Average orderabout SGD 68about SGD 51down 24%

Orders placed, on both screens. The change column and the average order are our arithmetic.

Time stamps on these screens
Data Period: By Month 2026.04 (GMT+08)
April 2026, the month we audited.
Data Period: By Month 2026.08 (GMT+08)
August 2026.
Order Type: Placed Order
Orders placed, on both screens. The section below shows the paid figure for August.
vs Previous Month
Against the month before. April prints dashes.

Visitors to buyers, August 2026

In August 4.32% of visitors bought. In the audit of April it was 1.93%.

This screen follows the visitors of the month down to the orders they placed and paid for, which is where the audit of April had found the leak.

AfterAugust 2026
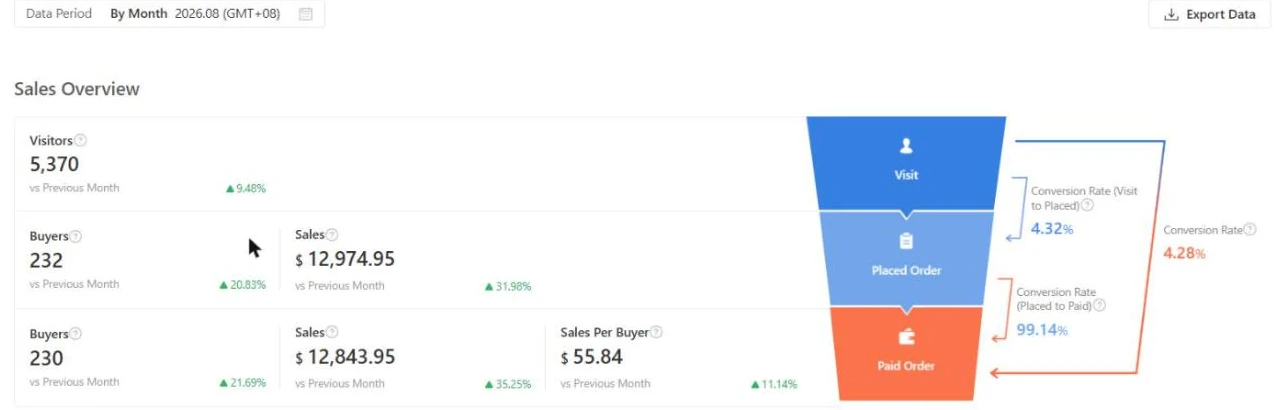
Screenshot: After. August 2026. Business Insights, Sales, Sales Overview Open the screenshot at its own size

Business Insights, Sales, Sales Overview

The sales overview closes the case. In August 2026, 5,370 visitors produced 232 buyers who placed SGD 12,974.95 of orders. 230 of them paid, 99.14% of the buyers who placed an order, for SGD 12,843.95.

The audit of April found the leak after the click: 1,191 visitors and 23 buyers, 1.93%. The same measure reads 4.32% here. The traffic grew, and more than twice as much of it bought.

On the screen, August 2026
Visitors5,370up 9.48%
Buyers, orders placed232up 20.83%
Visit to placed order4.32%
Sales for each paying buyerSGD 55.84up 11.14%

Changes against July 2026. The April figure in the headline is from our audit.

Time stamps on these screens
Data Period: By Month 2026.08 (GMT+08)
August 2026.
Placed Order, Paid Order
The second and third stages of the funnel, after Visit: orders placed, then orders paid.
Mouse pointer
Visible on the capture. Nothing on it is changed.

What would we change in your store?

Tell us about your store in a free consultation and we will tell you where we would start. If you want the detail first, the Full Store Diagnosis costs USD 20IDR 300.000 per store and takes 3 business days from payment and data.