Skip to content

Case studiesCase 01, Consumer electronics retailer

Seventeen months, six times the monthly sales.

Sales a monthSix times

BeforeJune 2024

IDR1.37billion

AfterNovember 2025

IDR8.18billion

A consumer electronics store on Shopee in Indonesia, told through its own Seller Centre: where it stood in June 2024, what we changed, a dip and the month after it, and where it stood in November 2025. The store stays unnamed. The figures are the ones on its screens.

  • Computer and IT retail
  • Shopee and TikTok Shop
  • Indonesia
  • Jun 2024 to Nov 2025
AfterNovember 2025
Screenshot: After. November 2025. Shopee Seller Centre, Performa Toko, Tinjauan Open the screenshot at its own size

Shopee Seller Centre, Performa Toko, Tinjauan

Orders a month
9,869
November 2025. From 3,248 in June 2024.
Three times
The dip
down 20.14%
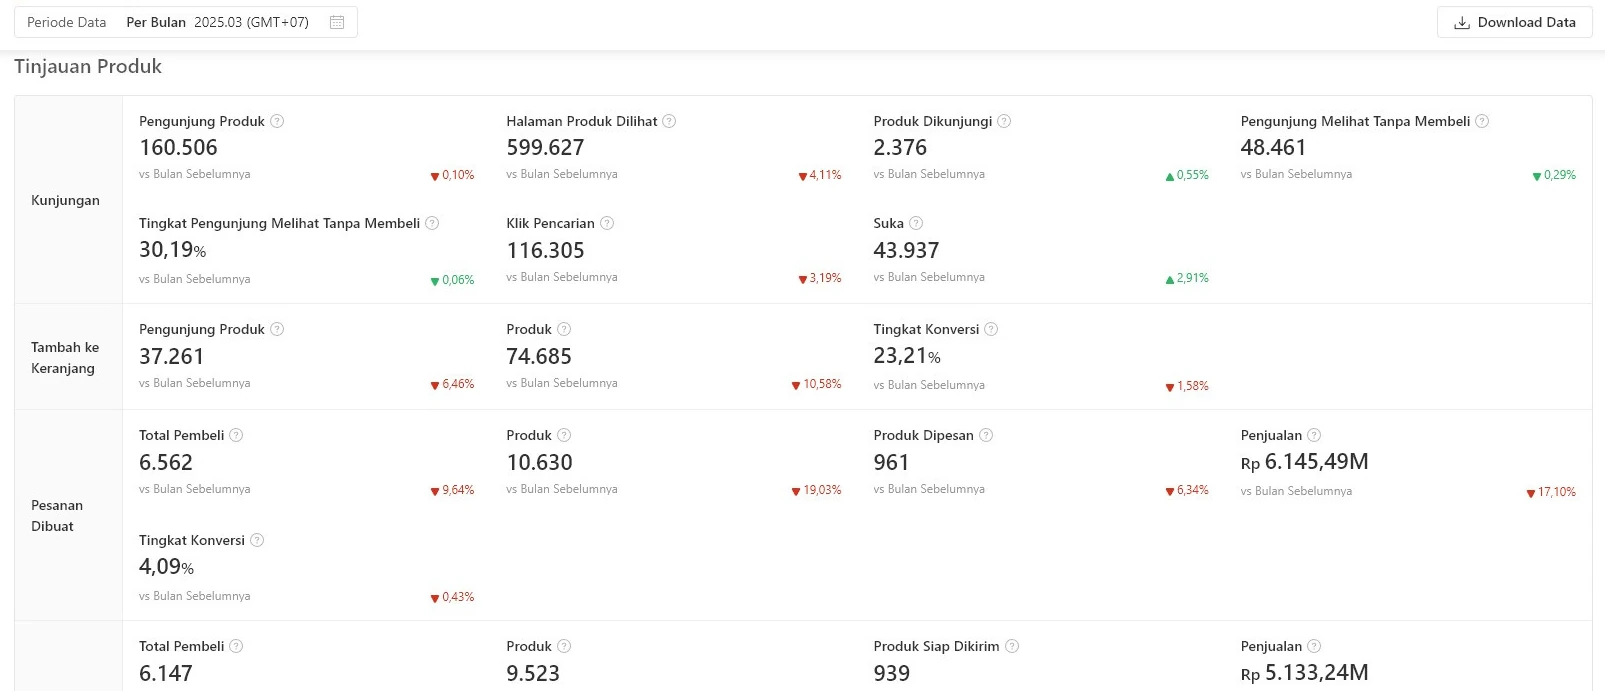
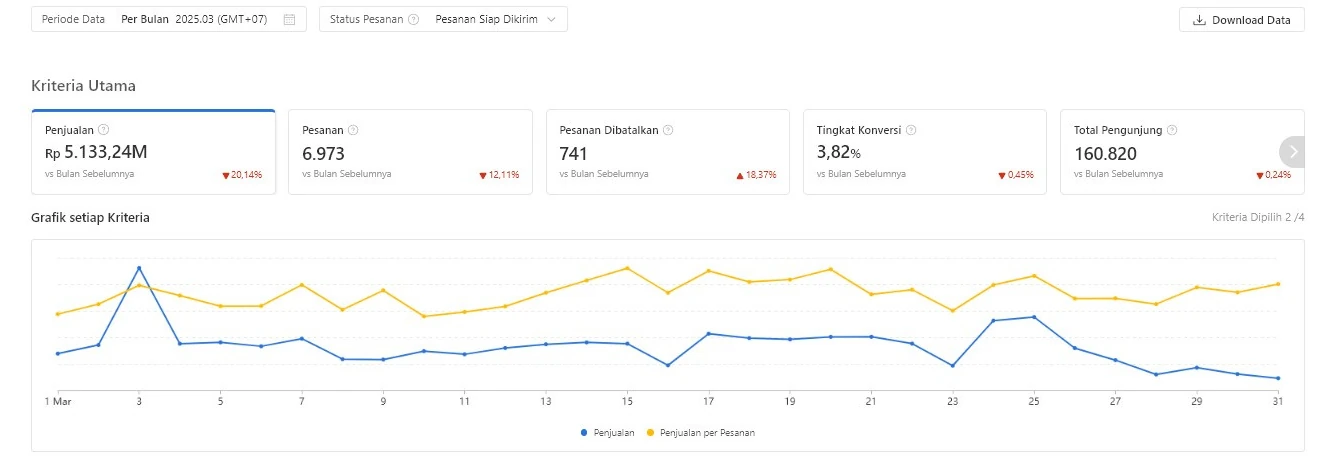
Sales against February. March 2025. IDR 5.13 billion that month.
The recovery
up 32.35%
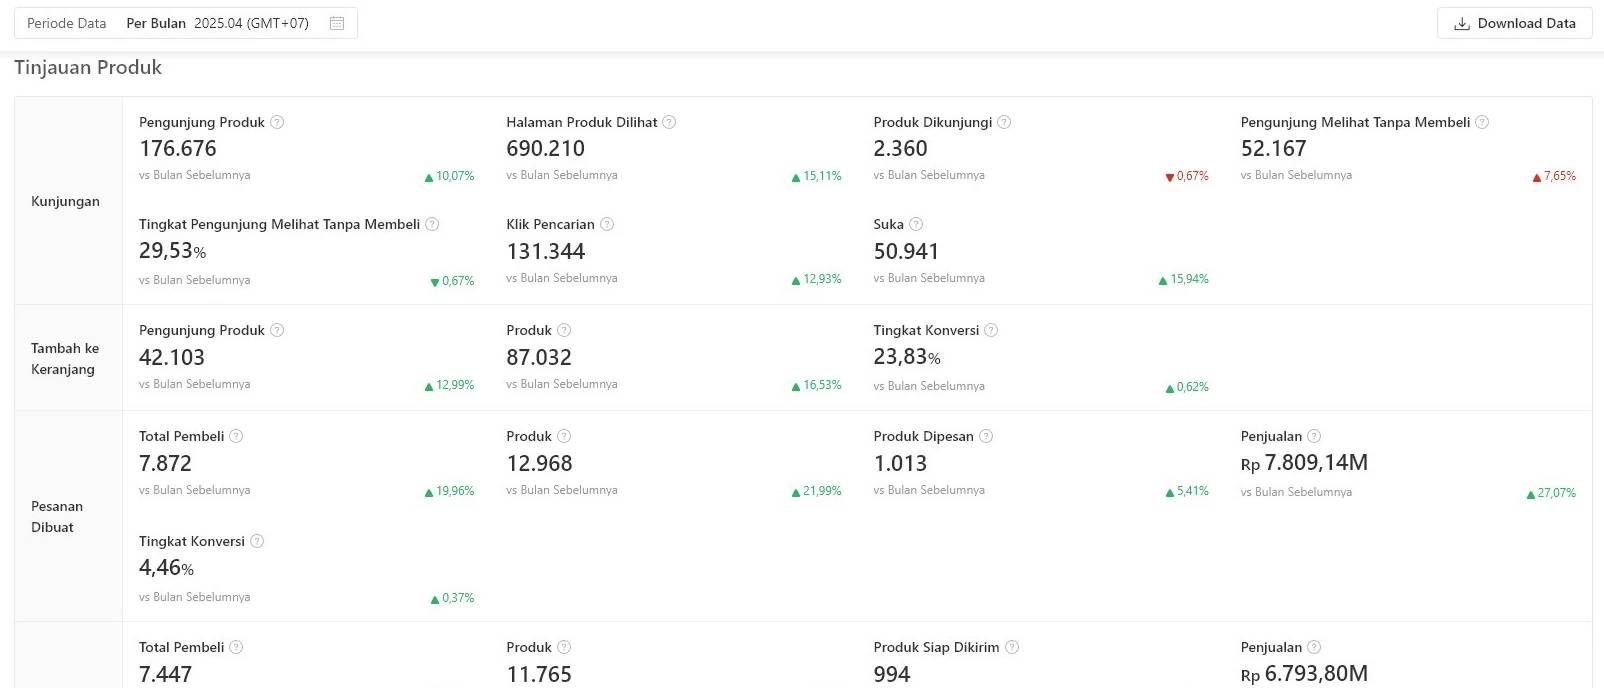
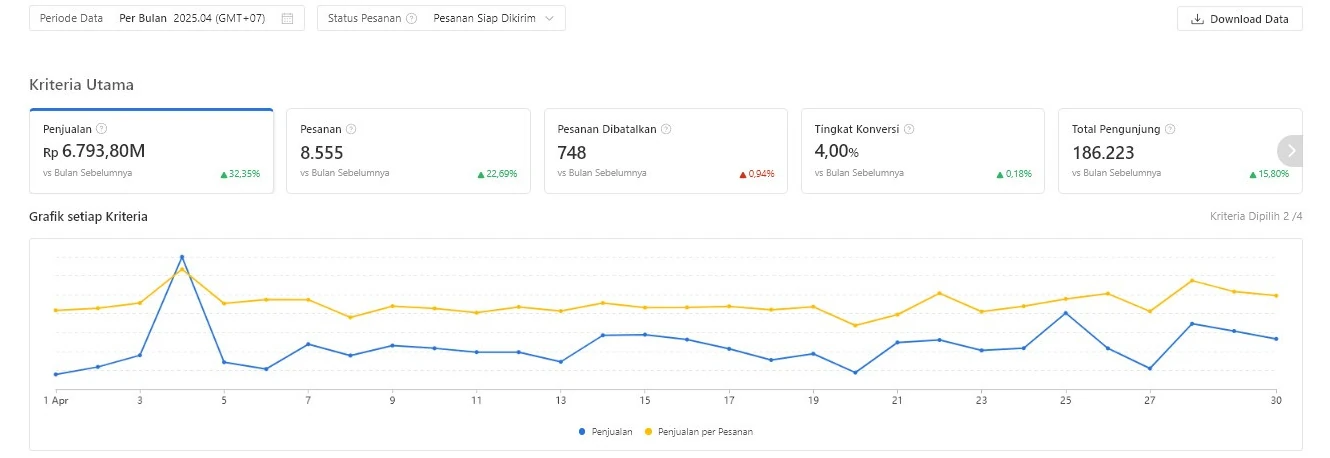
Sales against March. April 2025. IDR 6.79 billion that month.

From the Shopee Seller Centre of the store, per month, orders ready to ship. The multiples are our arithmetic.

In short

  1. The problem

    In June 2024 the store sold IDR 1.37 billion from 3,248 orders, and both were falling. Its ad budget was spread thin across shop wide campaigns, with no clear view of which products carried the store.

  2. What we changed

    We moved the ad spend off shop wide campaigns and onto single products, rebuilt the listings around what shoppers type into Shopee search, tracked competitors, and added TikTok Shop and an affiliate programme.

  3. The result

    In November 2025 the same screen read IDR 8.18 billion from 9,869 orders, six times the sales of June 2024. Not every month went up: sales fell 20.14% in March 2025 and rose 32.35% in April.

The problem

Sales and orders, both falling.

June 2024

This is the starting line: the store on its own Seller Centre in the month we started managing the account, and the month the result is measured against.

  • BeforeJune 2024: sales of IDR 1.37 billion a month, when we started managing the account.
  • AfterNovember 2025: sales of IDR 8.18 billion a month.
BeforeJune 2024
Screenshot: Before. June 2024. Shopee Seller Centre, Performa Toko, Tinjauan Open the screenshot at its own size

Shopee Seller Centre, Performa Toko, Tinjauan

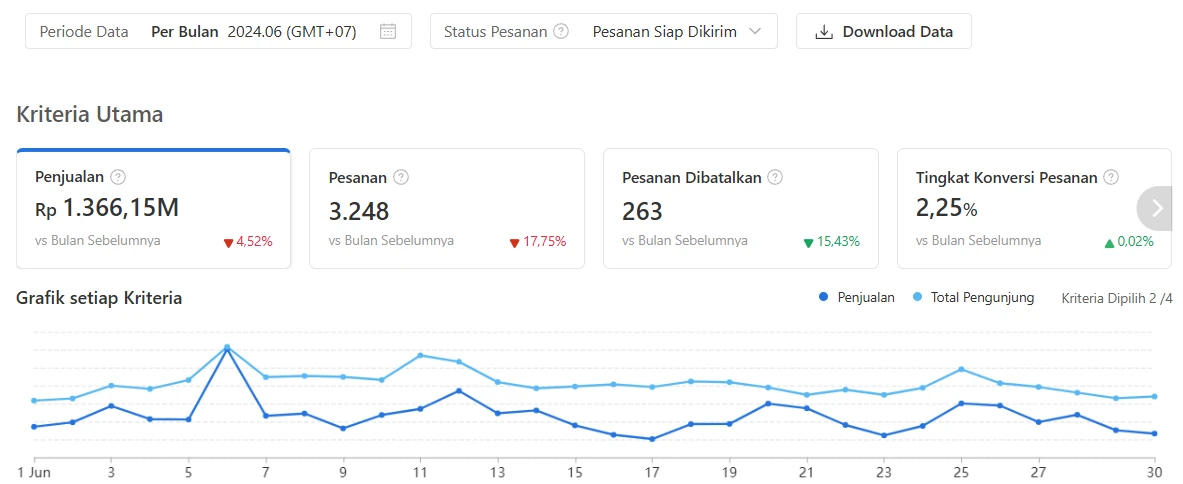
June 2024 is where the story starts. The store sold IDR 1.37 billion that month, 4.52% less than in May, from 3,248 orders, down 17.75%.

The ad budget was spread thin across shop wide campaigns, with no clear view of which products carried the store. So the first job was not to spend more. It was to find where the money already worked.

On the screen, June 2024
SalesIDR 1.37 billiondown 4.52%
Orders3,248down 17.75%
Cancelled orders263down 15.43%
Order conversion2.25%up 0.02%

Changes against the month before, as Shopee shows them.

Time stamps on these screens
Per Bulan 2024.06 (GMT+07)
One calendar month, June 2024, Jakarta time.
Status Pesanan: Pesanan Siap Dikirim
Only orders that reached ready to ship are counted.
vs Bulan Sebelumnya
Each small percentage compares June with May 2024.
Rp 1.366,15M
On this screen M is million and the comma is a decimal point: 1,366.15 million rupiah, which is IDR 1.37 billion.
What we changed

Off shop wide campaigns, onto single products.

We changed four things, from where the ad budget went to where the store sells.

  • Ads on single products

    Paid spend moved off shop wide campaigns and onto single products, at exact match and on low bids.

  • Listings rebuilt for search

    Titles, attributes, photos and descriptions rebuilt around what shoppers type into Shopee search.

  • Competitors tracked

    Competitor prices and their hero products tracked alongside the store.

  • TikTok Shop and affiliates

    TikTok Shop and an affiliate programme added alongside Shopee.

Two months inAugust 2024
Screenshot: Two months in. August 2024. Same screen as June 2024 Open the screenshot at its own size

Same screen as June 2024

Five months inNovember 2024
Screenshot: Five months in. November 2024. Same screen Open the screenshot at its own size

Same screen

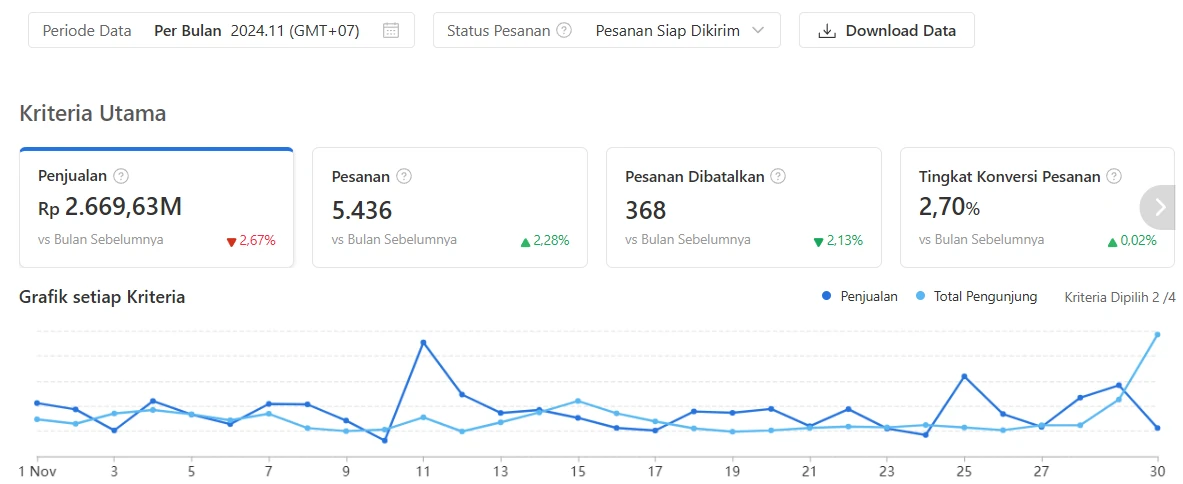
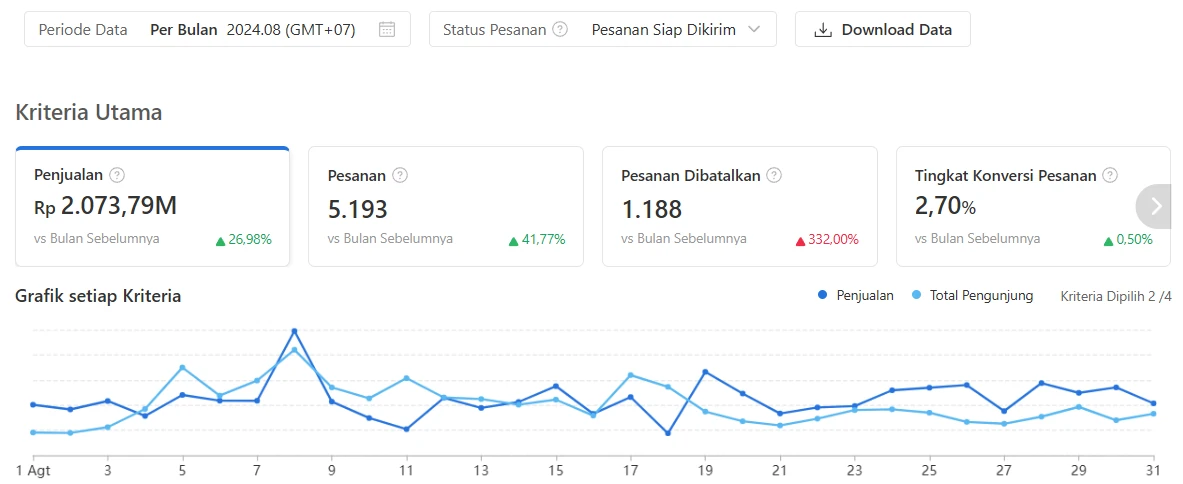
The first months on the new setup. August 2024, two months in: IDR 2.07 billion from 5,193 orders. November 2024, five months in: IDR 2.67 billion from 5,436 orders.

Time stamps on these screens
Per Bulan 2024.08 and 2024.11 (GMT+07)
Two calendar months, each on its own capture, ready to ship orders.
1 Agt, 1 Nov
The chart axis, one point per day. Agt is Agustus, August.

Shopee Ads, March to April 2025

Ad sales from IDR 901.6 million to IDR 1.7 billion in a month.

The same ads page one month apart shows what moving the budget did: a little more spend, and nearly twice the sales from ads.

BeforeMarch 2025
Screenshot: Before. March 2025. Iklan Shopee, Semua Iklan Per-Klik Open the screenshot at its own size

Iklan Shopee, Semua Iklan Per-Klik

AfterApril 2025
Screenshot: After. April 2025. Same screen Open the screenshot at its own size

Same screen

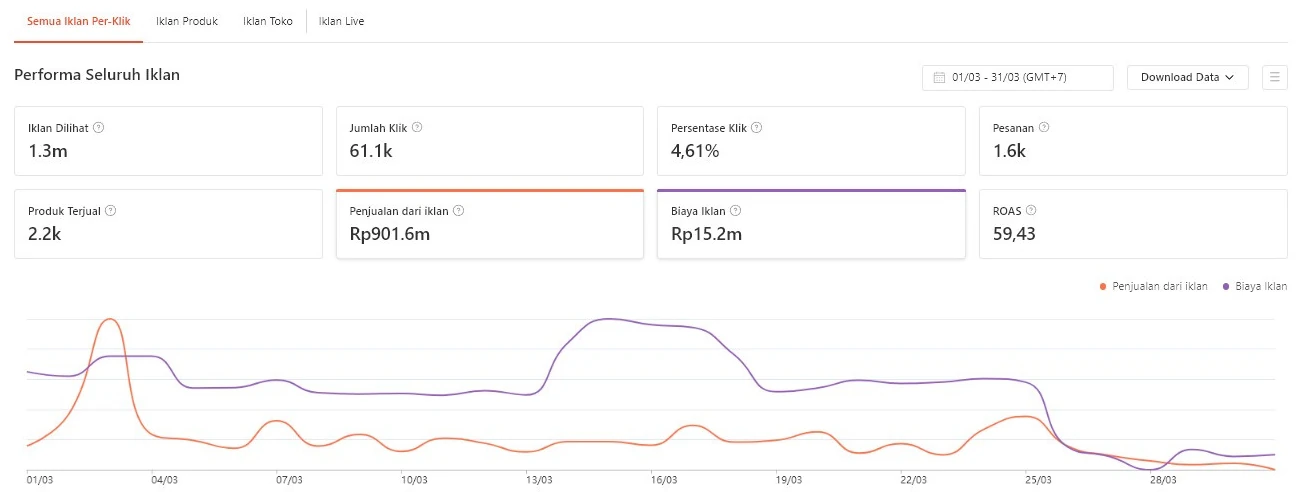
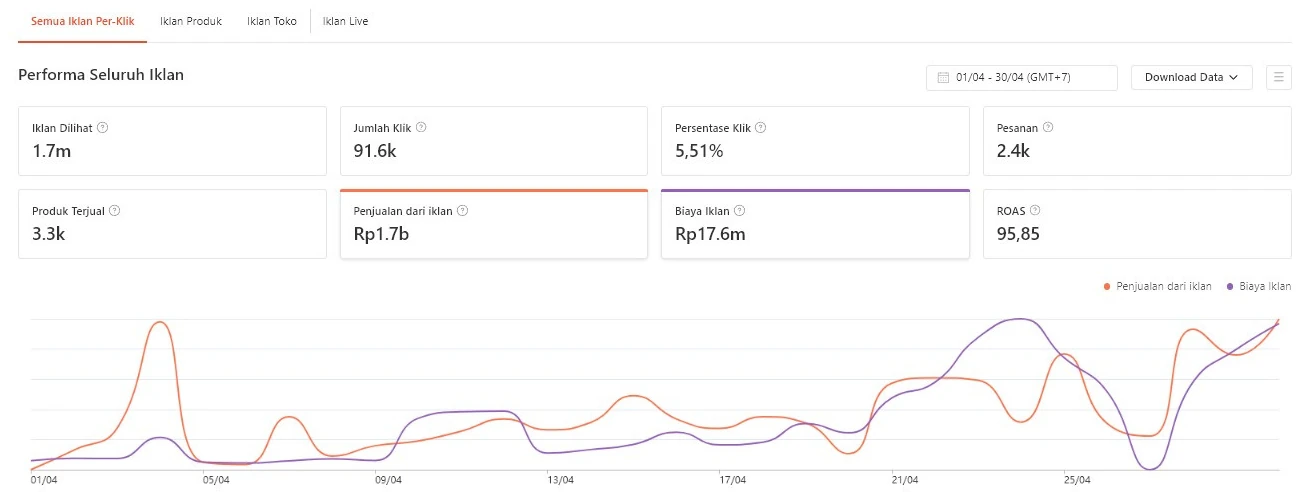
This is the ads page for every pay per click campaign in the store. In March 2025 the ads sold IDR 901.6 million on IDR 15.2 million of spend. In April they sold IDR 1.7 billion on IDR 17.6 million.

The method was to move budget toward products with a high margin or low visibility, while spend on the existing best sellers was held steady. Spend rose by about a sixth. The sales it bought nearly doubled.

On the two screens
Mar 2025Apr 2025
Ad salesIDR 901.6 millionIDR 1.7 billion
Ad spendIDR 15.2 millionIDR 17.6 million
Clicks61.1 thousand91.6 thousand
Orders1.6 thousand2.4 thousand

The ads page rounds its tiles and prints no change against the month before. About a sixth and nearly doubled are our arithmetic.

Time stamps on these screens
01/03 - 31/03 (GMT+7) and 01/04 - 30/04 (GMT+7)
1 to 31 March and 1 to 30 April. Shopee Ads prints no year. Both captures come from the May 2025 portfolio, so the year is 2025.
Rp901.6m, Rp1.7b
On the ads page m is million and b is billion.

Shopee Ads, November 2025

By November, IDR 2.8 billion of ad sales on IDR 18.4 million of spend.

The same page eight months later shows where the gain came from: not from more clicks, but from fewer wasted ones.

AfterNovember 2025
Screenshot: After. November 2025. Iklan Shopee, Semua Iklan Per-Klik, the newer six tab layout Open the screenshot at its own size

Iklan Shopee, Semua Iklan Per-Klik, the newer six tab layout

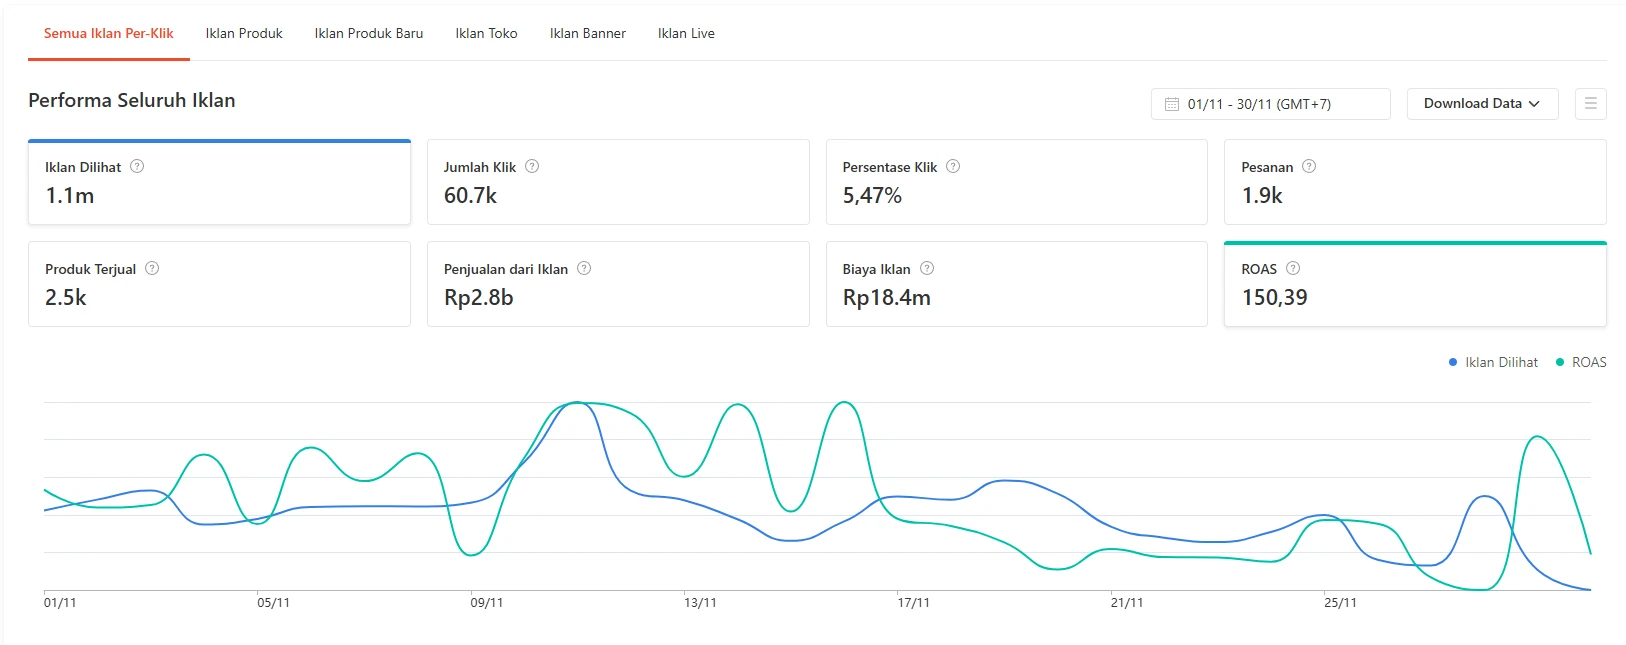
Eight months after March the same page reads IDR 2.8 billion of ad sales on IDR 18.4 million of spend. Clicks are back at the March level, 60.7 thousand against 61.1 thousand, yet the ads sold about three times as much.

That is what single product ads on exact match keywords do: fewer wasted clicks, and each click lands on a product chosen because it sells.

On the screen, November 2025
Ad salesIDR 2.8 billion
Ad spendIDR 18.4 million
Ads seen1.1 million
Clicks60.7 thousand
Click rate5.47%
Orders1.9 thousand
Products sold2.5 thousand

About three times is our arithmetic, against March 2025 in the section before.

Time stamps on these screens
01/11 - 30/11 (GMT+7)
1 to 30 November. No year on screen. The page is the newer six tab layout, later than the two 2025 captures, so this is November 2025, the 11.11 month.
Rp2.8b, Rp18.4m, 1.1m
On the ads page b is billion and m is million.

One product ad, November to December 2025

One product ad, with its main keyword on a low bid.

Here is the mechanism on a single ad.

BeforeNovember 2025
Screenshot: Before. November 2025. Iklan Shopee, Rincian Iklan Produk Open the screenshot at its own size

Iklan Shopee, Rincian Iklan Produk

AfterDecember 2025
Screenshot: After. December 2025. Same product ad Open the screenshot at its own size

Same product ad

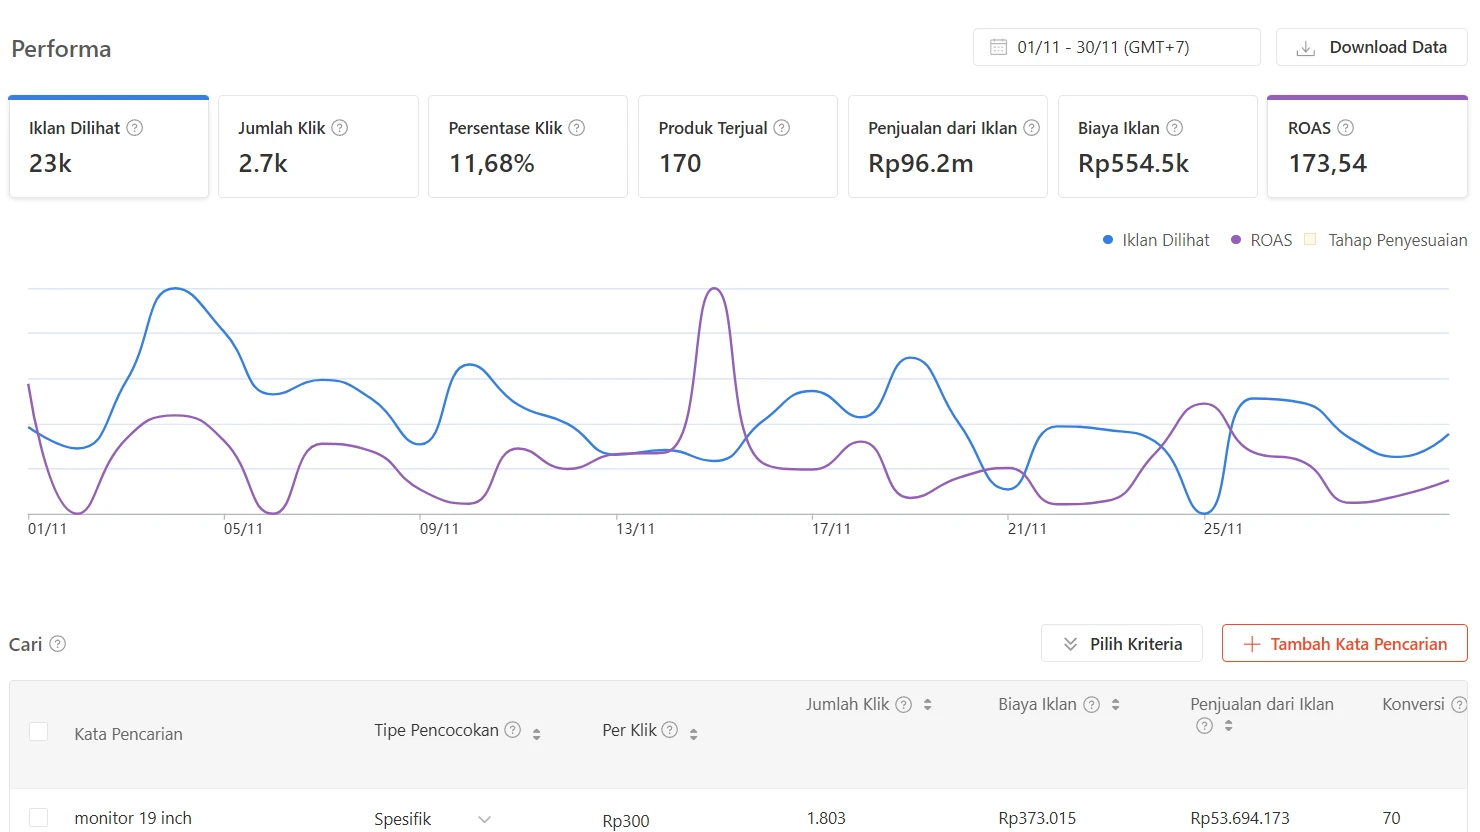
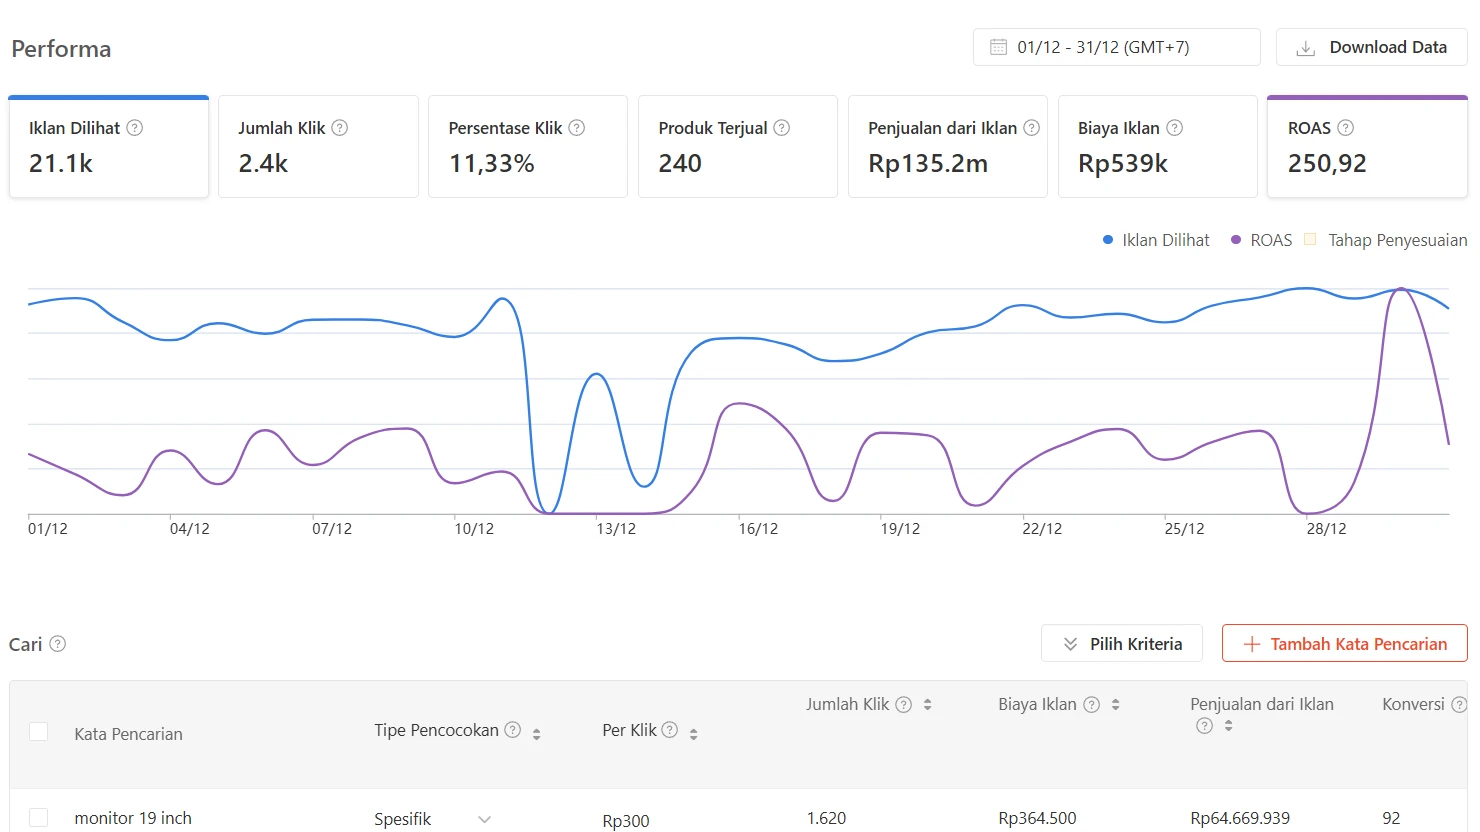
The same product ad, one month apart: IDR 96.2 million of ad sales on IDR 554.5 thousand of spend in November 2025, then IDR 135.2 million on IDR 539 thousand in December, the month after the result month of this case.

Its main keyword, monitor 19 inch, runs on exact match at a bid of IDR 300 a click. That one keyword returned IDR 53,694,173 in November and IDR 64,669,939 in December.

On the two screens
Nov 2025Dec 2025
Ad salesIDR 96.2 millionIDR 135.2 million
Ad spendIDR 554.5 thousandIDR 539 thousand
Main keyword salesIDR 53,694,173IDR 64,669,939
Time stamps on these screens
01/11 - 30/11 (GMT+7)
1 to 30 November. No year on screen. Our files name it 2025, and a full December on file by September 2026 can be no later than 2025.
01/12 - 31/12 (GMT+7)
1 to 31 December. By the same reasoning, 2025.
Spesifik, Per Klik Rp300
Exact match keyword, with a bid of IDR 300 per click.

Traffic, March to November 2025

Visitors a month went from 160,820 to 183,293.

More people were reaching the store, both people new to it and people coming back.

BeforeMarch 2025
Screenshot: Before. March 2025. Performa Toko, Tingkat Kunjungan Open the screenshot at its own size

Performa Toko, Tingkat Kunjungan

AfterNovember 2025
Screenshot: After. November 2025. Same screen Open the screenshot at its own size

Same screen

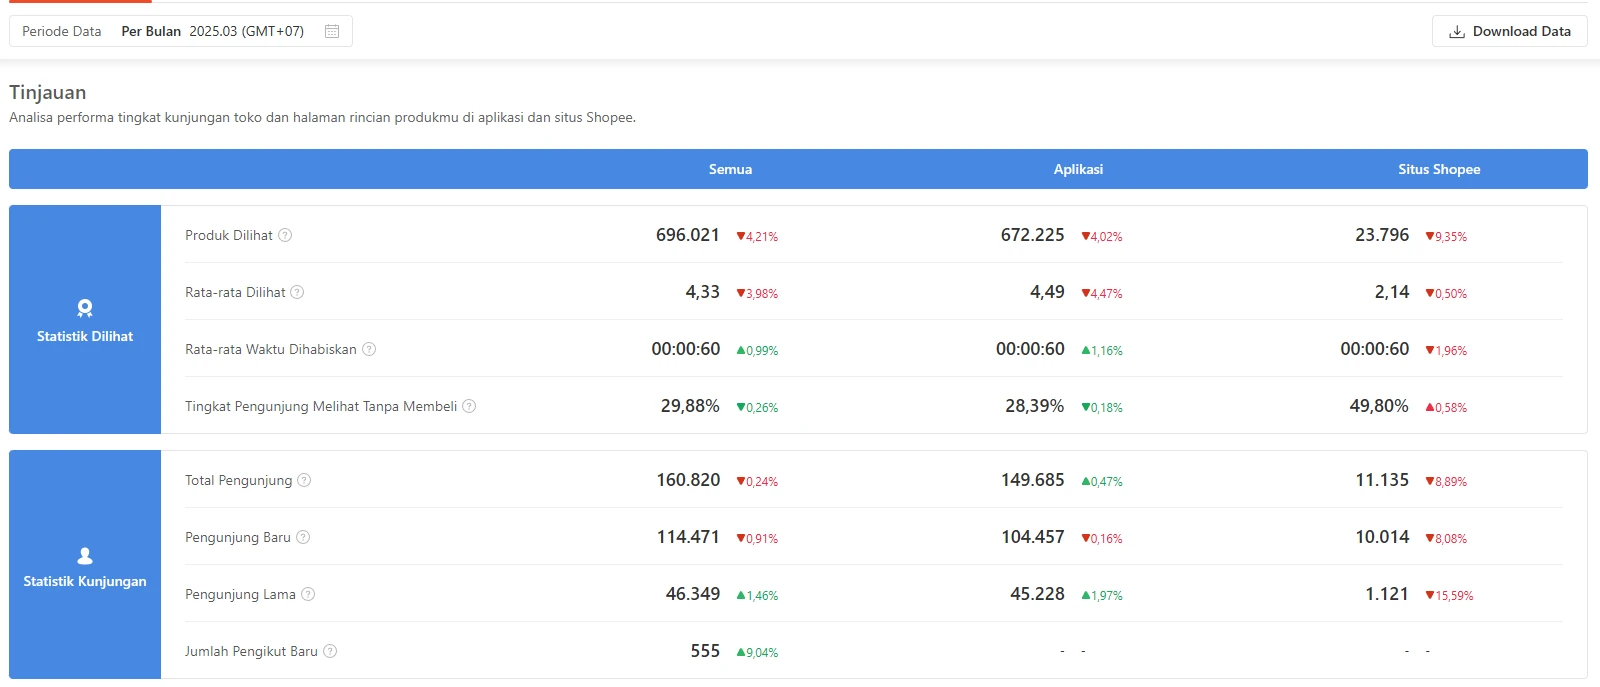
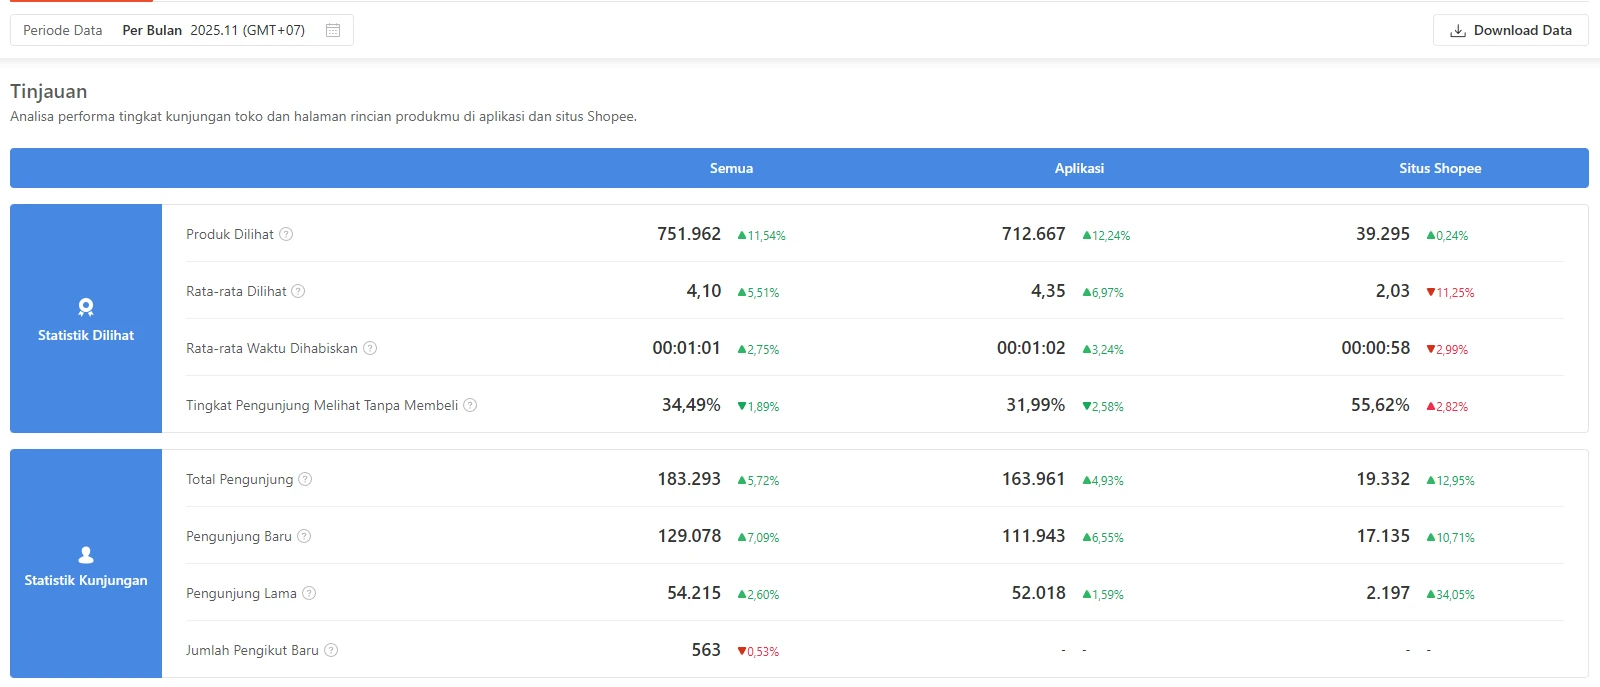
The traffic page counts everyone who reached the store or one of its product pages. In March 2025 that was 160,820 visitors and 696,021 product views. In November 2025 it was 183,293 visitors and 751,962 product views.

New visitors grew from 114,471 to 129,078 and returning visitors from 46,349 to 54,215, so the growth came from both reach and repeat custom.

On the two screens
Mar 2025Nov 2025
Visitors160,820183,293
Product views696,021751,962
New visitors114,471129,078
Returning visitors46,34954,215

The percentages on each screen compare with its own month before, not with the other screen.

Time stamps on these screens
Per Bulan 2025.03 (GMT+07), 2025.11 (GMT+07)
March 2025 and November 2025.
Semua, Aplikasi, Situs Shopee
All traffic, the app, and the website.
00:00:60, 00:01:01
Average time on a page, in hours, minutes and seconds. Shopee prints sixty seconds as 00:00:60.

Affiliates, March to April 2025

Affiliate sales went from IDR 1 billion to IDR 1.6 billion in one month.

Affiliates did more than add sales: most of the buyers they brought had never bought from the store before.

BeforeMarch 2025
Screenshot: Before. March 2025. Affiliate Marketing Solution, Metrik Utama Open the screenshot at its own size

Affiliate Marketing Solution, Metrik Utama

AfterApril 2025
Screenshot: After. April 2025. Same screen Open the screenshot at its own size

Same screen

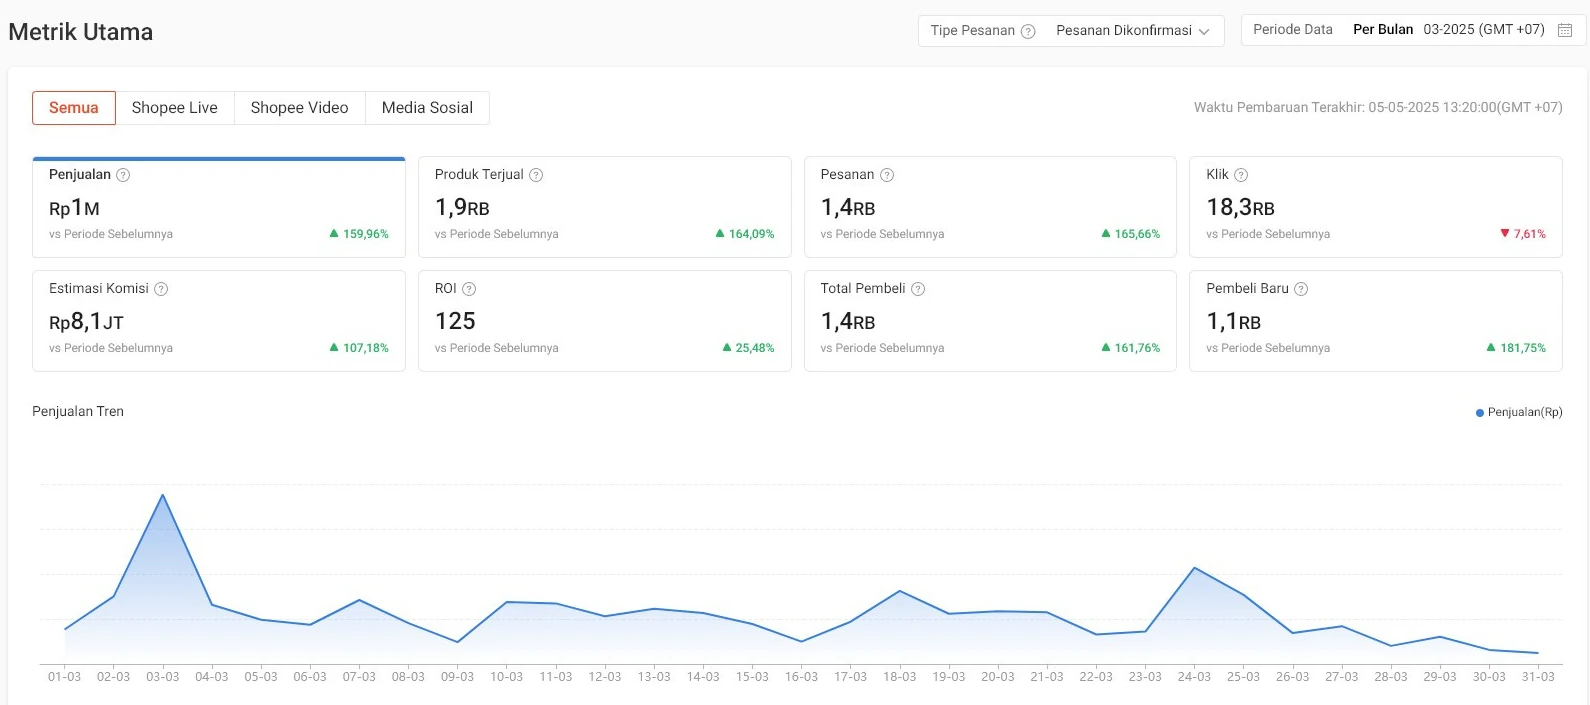
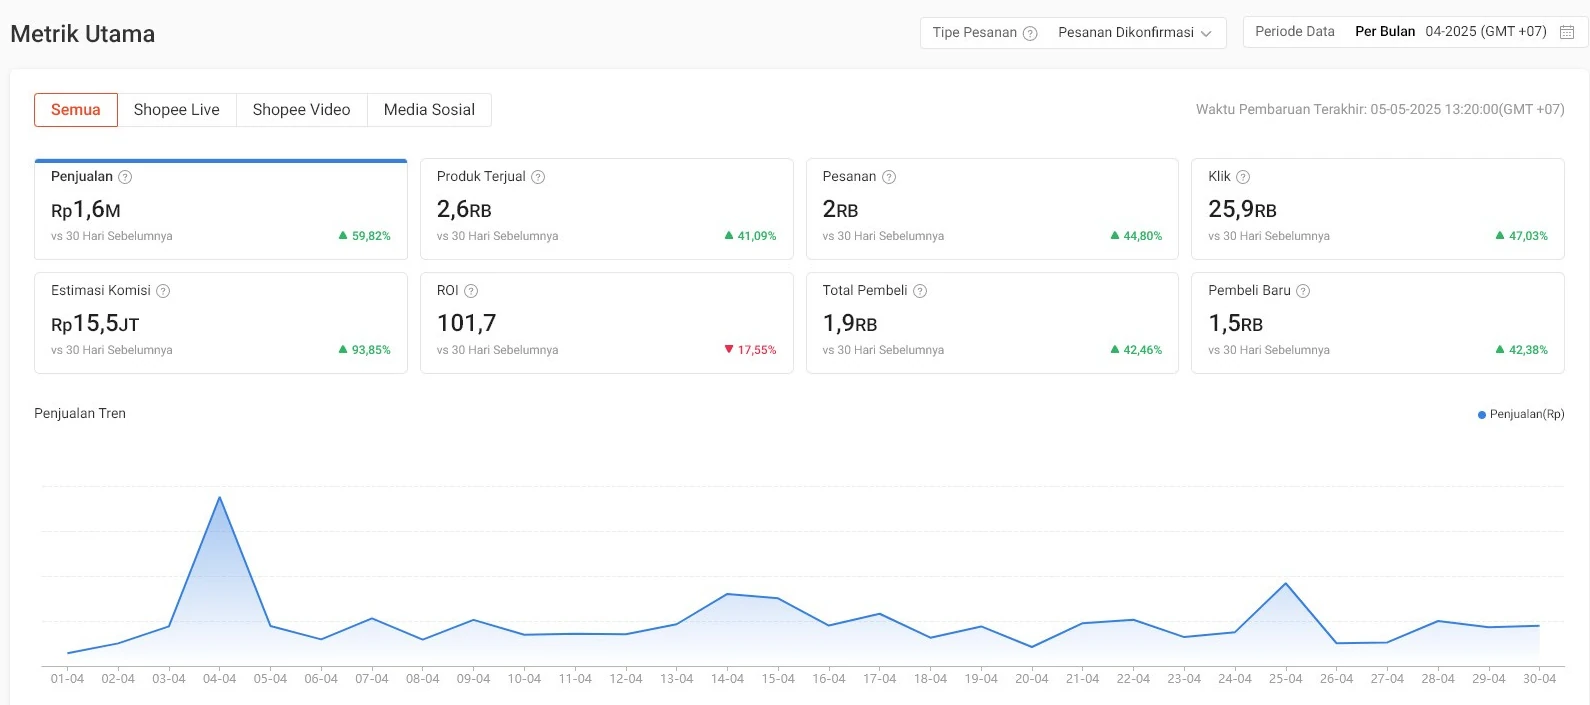
The affiliate programme pays creators a commission on what they sell. In March 2025 it brought IDR 1 billion of confirmed sales for an estimated IDR 8.1 million of commission. In April it brought IDR 1.6 billion for IDR 15.5 million.

Orders went from 1.4 thousand to 2 thousand, and new buyers from 1.1 thousand to 1.5 thousand: most affiliate buyers had never bought from the store before.

On the two screens
Mar 2025Apr 2025
Affiliate salesIDR 1 billionIDR 1.6 billion
Estimated commissionIDR 8.1 millionIDR 15.5 million
Orders1.4 thousand2 thousand
New buyers1.1 thousand1.5 thousand

This page rounds its figures.

Time stamps on these screens
Per Bulan 03-2025 (GMT +07), 04-2025 (GMT +07)
March 2025 and April 2025.
Waktu Pembaruan Terakhir: 05-05-2025 13:20:00 (GMT +07)
Last data refresh: 5 May 2025 at 13:20 Jakarta time. Both captures were taken on or after that.
Tipe Pesanan: Pesanan Dikonfirmasi
Confirmed orders only.
Rp1,6M, Rp15,5JT, 1,4RB
On this page M is miliar (billion), JT is million, RB is thousand.

TikTok Shop, August to September 2025

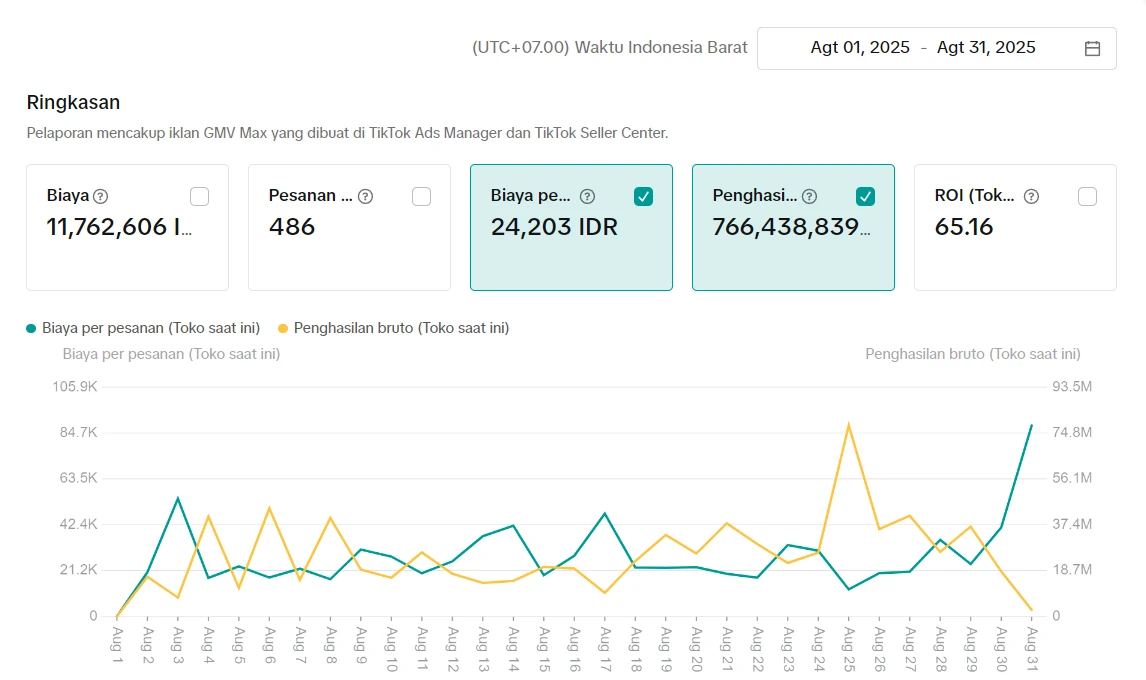
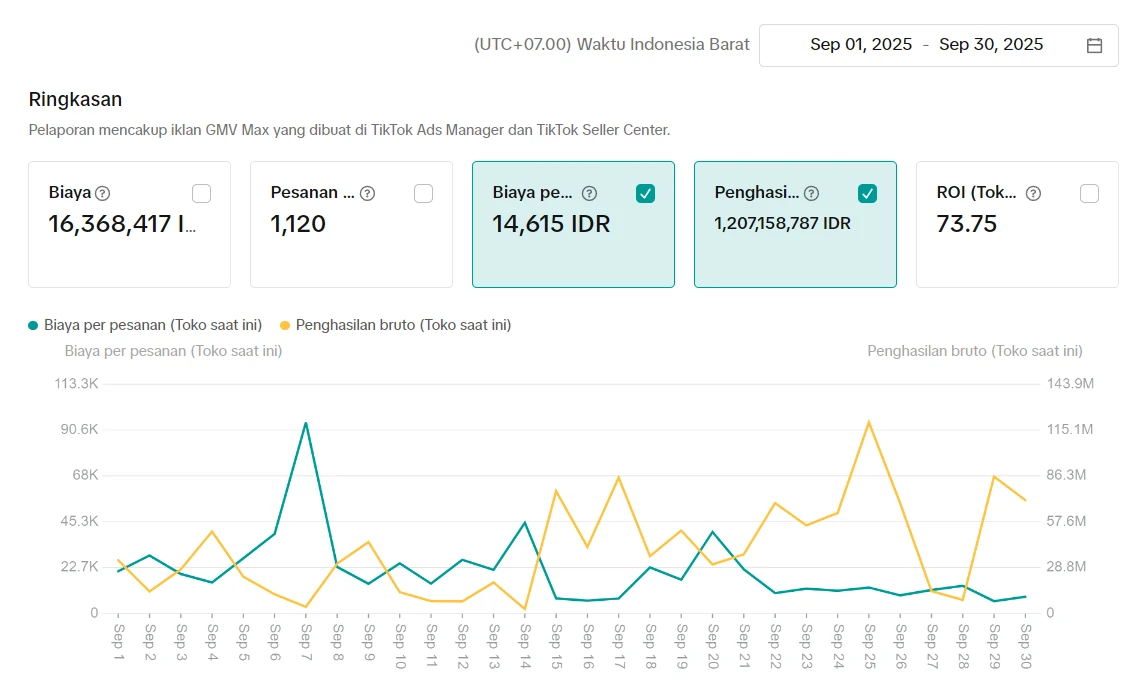
On TikTok Shop, revenue from GMV Max ads went from IDR 766.4 million to IDR 1.21 billion.

A second channel beside Shopee, where the ads brought more revenue and more orders in September than in August while each order cost less.

BeforeAugust 2025
Screenshot: Before. August 2025. TikTok Shop Seller Center, GMV Max, Ringkasan Open the screenshot at its own size

TikTok Shop Seller Center, GMV Max, Ringkasan

AfterSeptember 2025
Screenshot: After. September 2025. Same screen Open the screenshot at its own size

Same screen

TikTok Shop was added as a second channel beside Shopee. Its GMV Max ads brought IDR 766,438,839 of gross revenue from 486 orders in August 2025, and IDR 1,207,158,787 from 1,120 orders in September.

Spend went from IDR 11,762,606 to IDR 16,368,417, while the cost of each order fell from IDR 24,203 to IDR 14,615.

On the two screens
Aug 2025Sep 2025
Gross revenueIDR 766,438,839IDR 1,207,158,787
Orders4861,120
Ad spendIDR 11,762,606IDR 16,368,417
Cost per orderIDR 24,203IDR 14,615
Time stamps on these screens
Agt 01, 2025 - Agt 31, 2025
1 to 31 August 2025. Agt is Agustus.
Sep 01, 2025 - Sep 30, 2025
1 to 30 September 2025.
(UTC+07.00) Waktu Indonesia Barat
Western Indonesia Time, the Jakarta time zone.
Blank area, top left
The shop name sat inside this dashboard and has been blanked. Nothing else on the capture is changed.

The dip and the recovery

A 20.14% dip, then a 32.35% rise.

March and April 2025

Not every month went up, and the dashboard shows it.

The dipMarch 2025
Screenshot: The dip. March 2025. Shopee Seller Centre, Performa Toko, Tinjauan Open the screenshot at its own size

Shopee Seller Centre, Performa Toko, Tinjauan

The recoveryApril 2025
Screenshot: The recovery. April 2025. Same screen Open the screenshot at its own size

Same screen

In March 2025 sales fell 20.14% on February, to IDR 5.13 billion, and orders fell 12.11%, to 6,973.

In April they came back: sales rose 32.35%, to IDR 6.79 billion, and orders rose 22.69%, to 8,555. By our arithmetic from the two screens, that put April sales about 5.7% above February.

On the two screens
Mar 2025Apr 2025
Sales, IDR billion5.13down 20.14%6.79up 32.35%
Orders6,973down 12.11%8,555up 22.69%
Visitors160,820down 0.24%186,223up 15.80%

Changes against the month before, as Shopee shows them.

Time stamps on these screens
Per Bulan 2025.03 (GMT+07), 2025.04 (GMT+07)
March 2025 and April 2025, ready to ship orders.
Five tiles instead of four
These two captures were taken in May 2025 with a wider window, so a fifth tile, Total Pengunjung, is visible.

The result

Six times the sales of June 2024.

November 2025

The same screen with the same filters, seventeen months apart, so the two months can be compared like for like.

BeforeJune 2024
Screenshot: Before. June 2024. Shopee Seller Centre, Performa Toko, Tinjauan Open the screenshot at its own size

Shopee Seller Centre, Performa Toko, Tinjauan

AfterNovember 2025
Screenshot: After. November 2025. Same screen, same filters Open the screenshot at its own size

Same screen, same filters

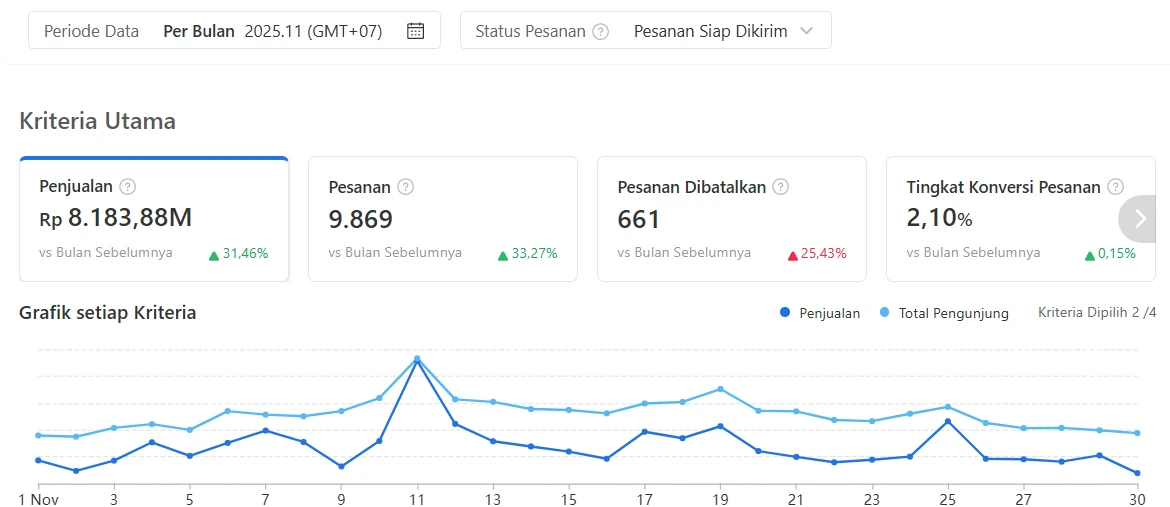
November 2025 closed at IDR 8.18 billion from 9,869 orders, against IDR 1.37 billion and 3,248 orders in June 2024. Sales grew faster than orders: the average order went from about IDR 421,000 to about IDR 829,000.

The peak on the 11th is the 11.11 campaign. Cancelled orders rose with the volume, from 263 to 661.

Before and after
Jun 2024Nov 2025Change
Sales a monthIDR 1.37 billionIDR 8.18 billion6.0 times
Orders a month3,2489,8693.0 times
Average orderabout IDR 421,000about IDR 829,0002.0 times

The change column and the average order are our arithmetic from the two screens.

Time stamps on these screens
Per Bulan 2024.06 (GMT+07)
One calendar month, June 2024, Jakarta time.
Per Bulan 2025.11 (GMT+07)
November 2025, the 11.11 month.
Status Pesanan: Pesanan Siap Dikirim
Only orders that reached ready to ship, on both screens.
Rp 8.183,88M
On this screen M is million: 8,183.88 million rupiah, which is IDR 8.18 billion.

Where the sales came from, November 2025

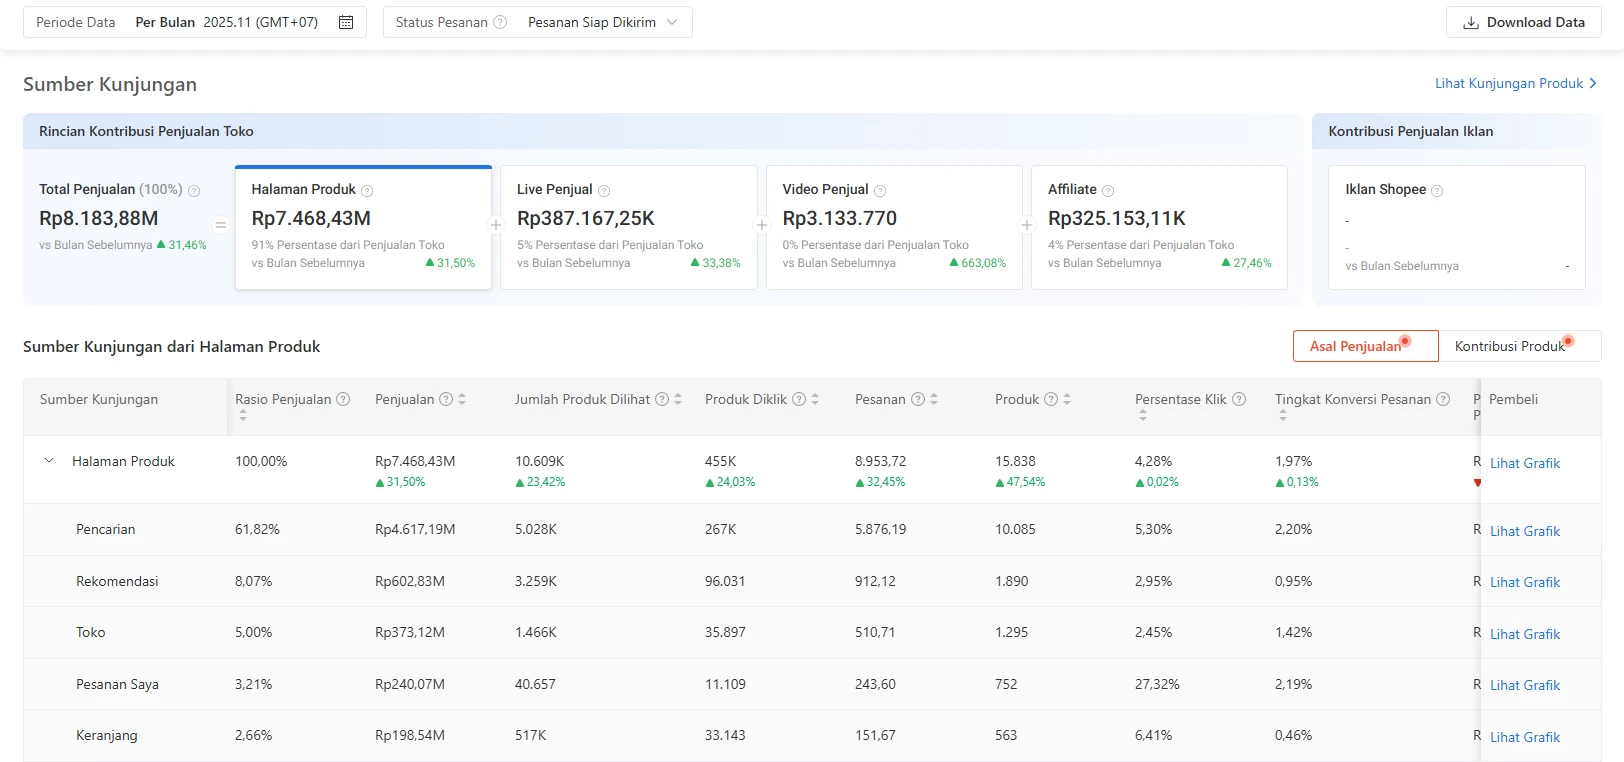
Search carried 61.82% of product page sales.

Most of the sales that month came through product pages, and most of those began with a search, which is where the listing work shows up.

AfterNovember 2025
Screenshot: After. November 2025. Performa Toko, Tinjauan, Sumber Kunjungan Open the screenshot at its own size

Performa Toko, Tinjauan, Sumber Kunjungan

The same overview breaks the month down by channel. Of IDR 8.18 billion, product pages brought IDR 7.47 billion, which is 91%. Seller live brought IDR 387.17 million and affiliates IDR 325.15 million.

Inside product page sales, search is the largest source at 61.82%, about IDR 4.62 billion, with recommendations next among the sources shown, at 8.07%. That is the listing work showing up as sales.

On the screen, November 2025
Product pagesIDR 7.47 billion
Seller liveIDR 387.17 million
AffiliateIDR 325.15 million
Search, share of product page sales61.82%
Recommendations8.07%
Time stamps on these screens
Per Bulan 2025.11 (GMT+07)
November 2025, ready to ship orders.
vs Bulan Sebelumnya
Against October 2025.
Iklan Shopee shows a dash
No figure on this capture. The screen gives no reason.
Affiliate Rp325.153,11K
November 2025, ready to ship orders. The affiliate page earlier in this case is March and April 2025, confirmed orders. Not comparable.

Orders that reached ready to ship, November 2025

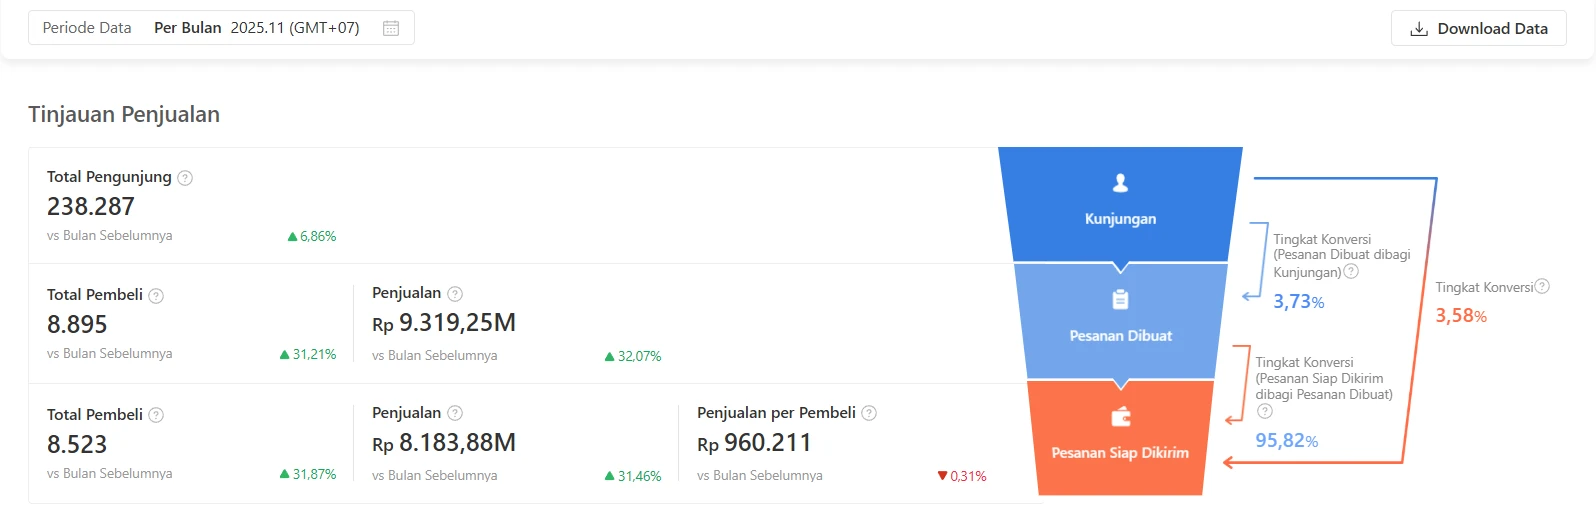
238,287 visitors, 8,895 buyers, and 95.82% of them reached ready to ship.

A sale only counts once the order is ready to ship.

AfterNovember 2025
Screenshot: After. November 2025. Performa Toko, Penjualan, Tinjauan Penjualan Open the screenshot at its own size

Performa Toko, Penjualan, Tinjauan Penjualan

In November 2025, 238,287 visitors produced 8,895 buyers who placed IDR 9.32 billion of orders.

8,523 of those buyers reached ready to ship, which is 95.82%, for the IDR 8.18 billion in the result above. Sales per buyer were IDR 960,211.

On the screen, November 2025
Visitors238,287up 6.86%
Buyers, orders created8,895up 31.21%
Buyers, ready to ship8,523
Created to ready to ship95.82%
Sales per buyerIDR 960,211

Changes against October 2025. This page counts visitors its own way: 238,287 here and 183,293 on the traffic page are not the same measure.

Time stamps on these screens
Per Bulan 2025.11 (GMT+07)
November 2025.
Pesanan Dibuat, Pesanan Siap Dikirim
Orders created, then orders that reached ready to ship.

What would we change in your store?

Tell us about your store in a free consultation and we will tell you where we would start. If you want the detail first, the Full Store Diagnosis costs USD 20IDR 300.000 per store and takes 3 business days from payment and data.