Skip to content

Case studiesCase 05, Homeware brand

Month one: sales up 43.58%, and every title rebuilt for search.

Sales a monthUp 43.58%

BeforeJune 2026

SGD19,603.63

AfterJuly 2026

SGD28,147.28

A homeware brand on Shopee in Singapore, with about half of its sales coming through affiliates. We audited it in June 2026 and began in July. Month one rebuilt every title for search, sorted the store into categories and traced, product by product, where the new traffic leaked. The store closed July 43.58% up on June. We traced the rise product by product: one listing that creators pushed carried the sales, and search, the part we rebuilt, brought 42.4% more clicks. The store stays unnamed. The sales and traffic figures are the ones on its screens.

  • Home and kitchen
  • Shopee Mall
  • Singapore
  • Jun to Jul 2026
AfterJuly 2026
Screenshot: After. July 2026. Shopee Seller Centre, Business Insights, Overview Open the screenshot at its own size

Shopee Seller Centre, Business Insights, Overview

Visitors a month
9,806
July 2026. Page views 41,020, up 56.46%.
Up 53.70%
Titles rewritten
32 of 32
Every listing in the store. One listing sold five times as much after its new title.
Live 9 July
Clicks from search
1,552
July 2026, in our reports. From 1,090 in June 2026.
Up 42.4%

From the Shopee Seller Centre of the store, per month, paid orders. Clicks from search and the listing that sold five times as much are from our reports on July for the client.

In short

  1. The problem

    In June 2026 the store sold SGD 19,603.63, down 21.99% on May. About half of its sales came through affiliates, while search and paid traffic were idle.

  2. What we changed

    In month one we rewrote all 32 titles for search, sorted the store into categories and walked it as a shopper would. A month one report then showed the owner, product by product, where the new traffic leaked, with a fix for each leak.

  3. The result

    July 2026 closed at SGD 28,147.28, up 43.58% on June. One listing that creators pushed carried the sales, and search, the part we rebuilt, brought 42.4% more clicks.

The problem

Sales down 21.99%, and half the store resting on one channel.

June 2026

This is the store in the month before our work: sales were down on May, no sale came through ads, and our audit found affiliates bringing about half of sales.

  • BeforeJune 2026: sales of SGD 19,603.63 a month, the month before our work.
  • AfterJuly 2026: sales of SGD 28,147.28 a month.
BeforeJune 2026
Screenshot: Before. June 2026. Shopee Seller Centre, Business Insights, Overview Open the screenshot at its own size

Shopee Seller Centre, Business Insights, Overview

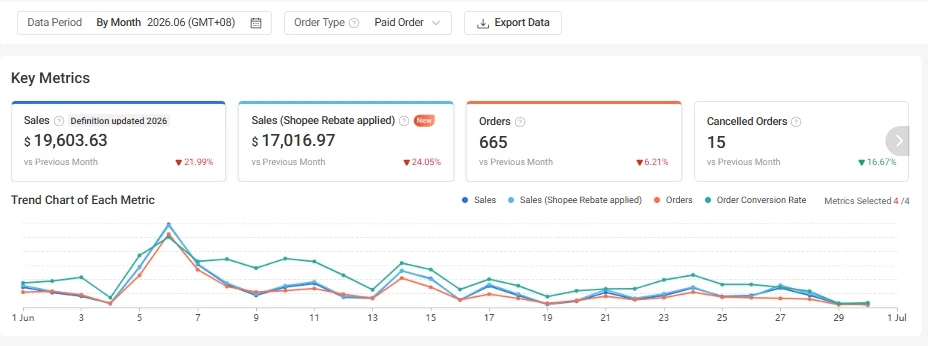
June 2026 is the month before our work. The store sold SGD 19,603.63, down 21.99% on May, from 665 orders. The ads card reads SGD 0.00: no sale came through Shopee Ads.

Our audit in June found one engine doing the work. Affiliates brought about half of sales, three of them carried 53% of that, and a third of it came through cashback and deal sites. Search and paid traffic were idle.

In the audit, June 2026

Sales through affiliates
About half
Top three affiliates
53% of affiliate sales
Cashback and deal sites
A third of affiliate sales
Shopee Ads
Unused
Shopee fees
19.6% of sales

From our audit of the order and affiliate exports, data to 18 June 2026. Not on the screen, which credits the last click: its Shopee Affiliate tile reads 4%.

Time stamps on these screens
Data Period: By Month 2026.06 (GMT+08)
June 2026, Singapore time.
Order Type: Paid Order
Paid orders only.
vs Previous Month
Each small percentage compares June with May 2026.
Real-time Metrics
The side panel shows the day of capture, not June.
What we changed

Titles shoppers search for, and a store that is easy to walk through.

Month one had one job: make the store findable in search, so it rests on more than one channel. Then find where the new traffic leaks.

  • 32 titles rewritten

    Every title now carries the phrase shoppers type, brand first, in 60 characters or fewer, with no keyword the product cannot honour. Live on 9 July.

  • The store sorted into categories

    A shopper can now walk the store by use. The structure was agreed with the owner, and the categories were live by 31 July.

  • A buyer side audit

    On 29 July we walked the store as a shopper would. Prices and sales across 26 competing stores set the benchmark.

  • A month one report

    On 31 July the owner got the month in numbers, product by product: what the new titles moved, where shoppers dropped out, and a fix for each listing that leaked.

The search review of 7 July set the rule for every title. One of the best sellers had been shown 56,665 times and clicked from search 67 times, because its title led with a collection name nobody types.

The new titles now carry words such as lunch box, searched 21,075 times a month, and water bottle, 72,588 times.

What was done, and when

  1. June 2026Audit of the affiliate programme and the cost of selling.
  2. 7 JulySearch review. 32 titles rewritten on search volume.
  3. 9 JulyAll 32 titles live, with the amendments of the owner.
  4. 29 to 30 JulyBuyer side audit of the listings. Store structure agreed with the owner.
  5. 31 JulyMonth one report. Store categories live.

Traffic, May to July 2026

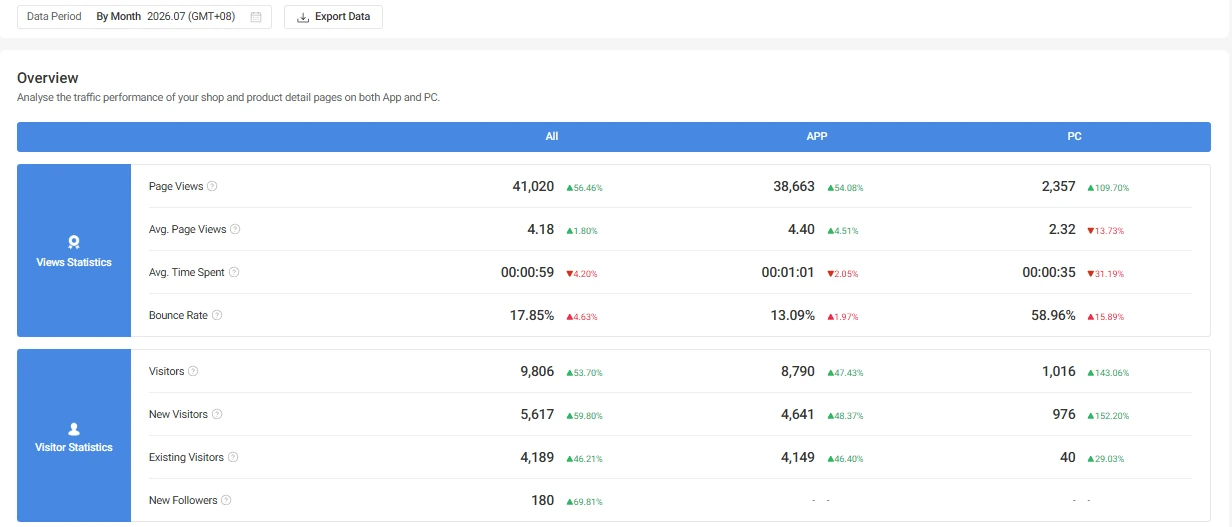
More people found the store: 9,806 visitors, up 53.70% on June.

The traffic page shows more visitors arriving in the first month with the new titles, and our reports show where they came from: creator links brought the larger part, and search added to it.

Two months earlierMay 2026
Screenshot: Two months earlier. May 2026. Business Insights, Traffic, Traffic Overview Open the screenshot at its own size

Business Insights, Traffic, Traffic Overview

Month oneJuly 2026
Screenshot: Month one. July 2026. Same screen Open the screenshot at its own size

Same screen

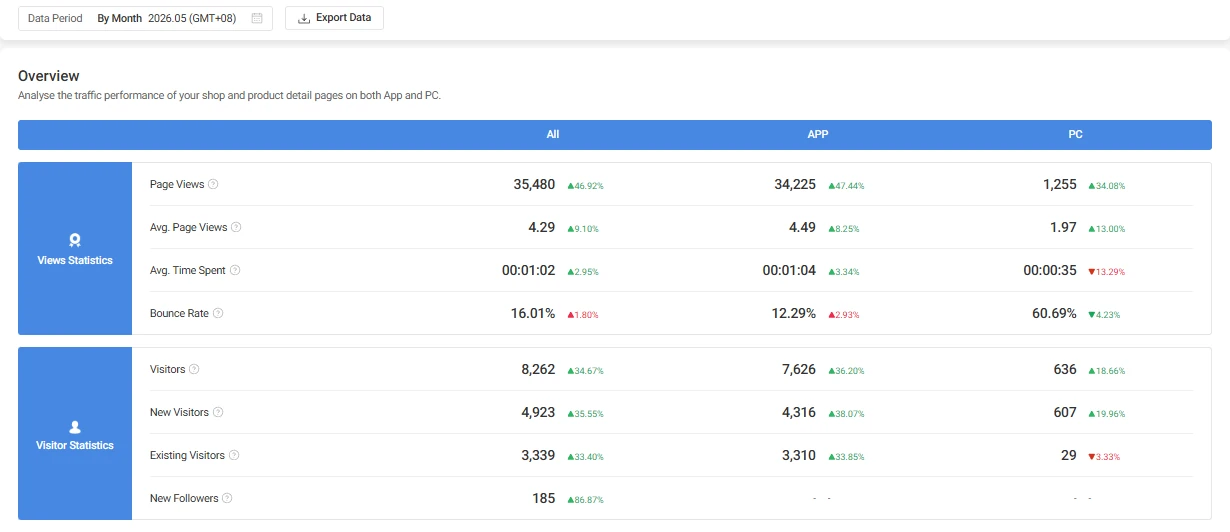
July 2026 is the first month with the new titles: 9,806 visitors, up 53.70% on June, and 41,020 page views, up 56.46%. In May the same page read 8,262 visitors and 35,480 page views. June, between them, was the low point.

Two things brought them. Creator links brought the larger part. Search, the part the titles moved, added to it: our reports on July count 1,552 clicks from Shopee search against 1,090 in June, 42.4% more, and one listing sold five times as much after its new title.

In our reports on July
JunJul
Clicks from search1,0901,552
Times products were shown243,274371,171
Share of those clicked5.10%6.91%
Product clicks, all sources12,40725,648
Sales of one listing, new titleSGD 64SGD 331

From our month one report and our July scorecard, 1 to 30 June against 1 to 30 July. Not on the screens above.

Time stamps on these screens
Data Period: By Month 2026.05 (GMT+08), 2026.07 (GMT+08)
May and July 2026. We hold no capture of this page for June.
The small percentages
No label is printed on this page. Shopee compares each month with the month before: May with April, July with June.
All, APP, PC
All traffic, the app, and the website.
Bounce Rate
Visitors who left after one page. A rise is bad, so its colours are reversed.

Where the sales came from, June to July 2026

Product card sales up 20.84%, with affiliate and video up more than four times.

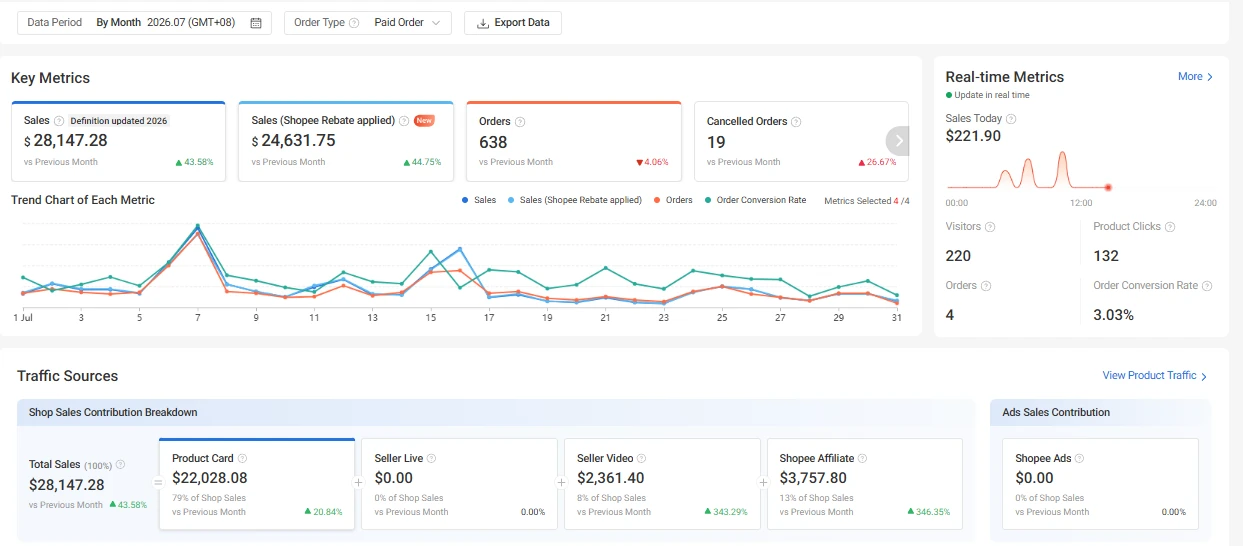
The same overview, a month apart, shows where the extra sales of July were made: product cards, affiliates and seller video all rose, and no sale came through ads in either month.

BeforeJune 2026
Screenshot: Before. June 2026. Business Insights, Overview, Traffic Sources Open the screenshot at its own size

Business Insights, Overview, Traffic Sources

AfterJuly 2026
Screenshot: After. July 2026. Same screen Open the screenshot at its own size

Same screen

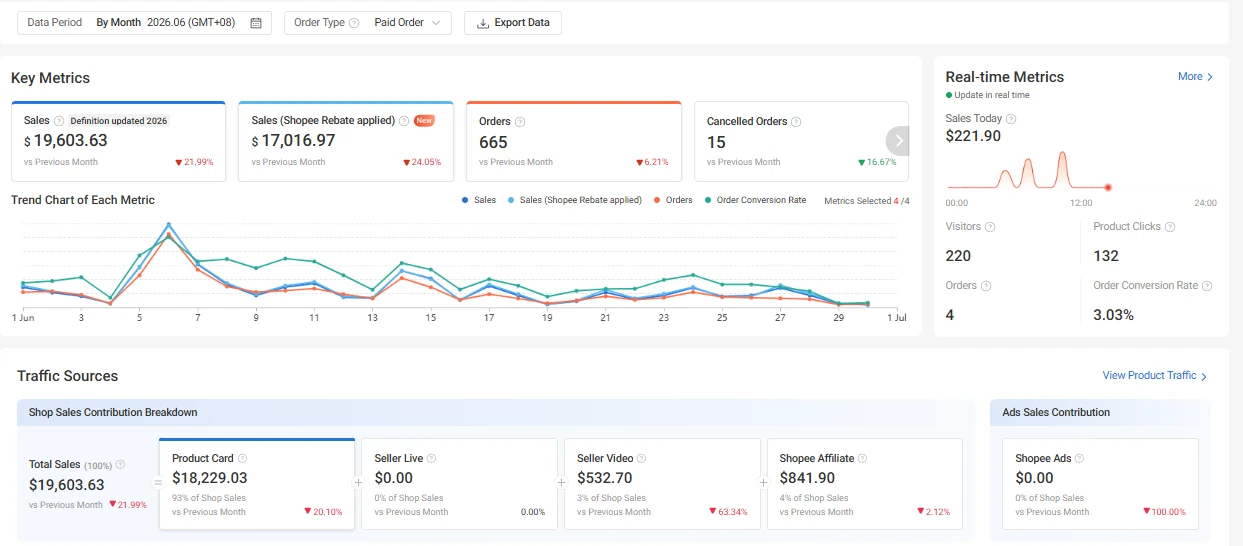
The overview splits each month by where the sale happened. Product cards, the line that search and creator links both feed, went from SGD 18,229.03 to SGD 22,028.08, up 20.84%. Our title work touches that line.

The creator programme, which we had audited in June, had a strong July: Shopee Affiliate went from SGD 841.90 to SGD 3,757.80. Seller video went from SGD 532.70 to SGD 2,361.40.

On the two screens
Jun 2026Jul 2026
Product cardsSGD 18,229.03SGD 22,028.08up 20.84%
Shopee AffiliateSGD 841.90SGD 3,757.80up 346.35%
Seller videoSGD 532.70SGD 2,361.40up 343.29%
Sales touched by adsSGD 0.00SGD 0.00

This overview credits each sale to the last click before it. More than four times is our arithmetic.

Time stamps on these screens
Data Period: By Month 2026.06 (GMT+08), 2026.07 (GMT+08)
June and July 2026, paid orders.
Real-time Metrics
The day of capture, not the month. Both were captured on the same day.
vs Previous Month
Against the month before.

Visitors to buyers, July 2026

Sales for each buyer up 53.30%: the screen that explains July.

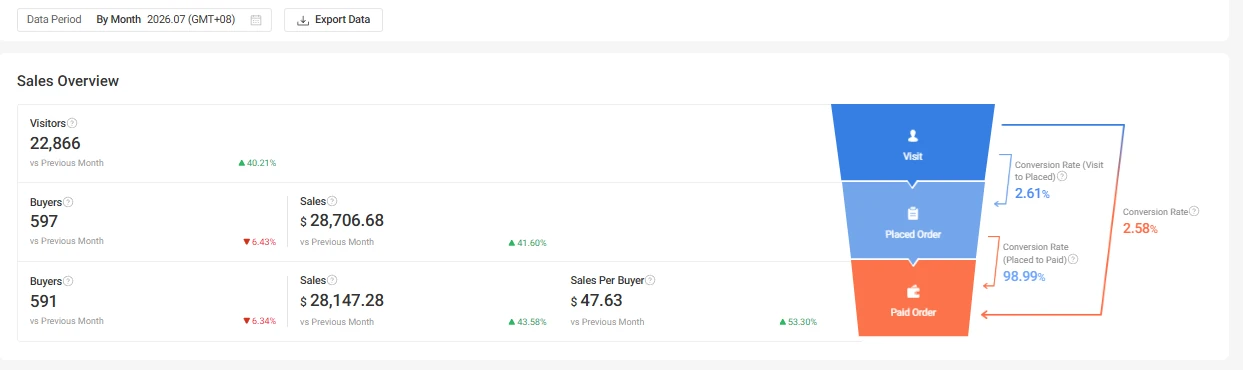
This screen shows that July grew because each buyer spent more, not because more people bought.

Month oneJuly 2026
Screenshot: Month one. July 2026. Business Insights, Sales, Sales Overview Open the screenshot at its own size

Business Insights, Sales, Sales Overview

Sales for each buyer rose 53.30%, to SGD 47.63, while buyers fell 6.34%, to 591. The store did not win more customers that month. It sold them bigger baskets.

Our report traced it to one listing that creators pushed hard: its sales went from SGD 1,948 to SGD 10,298, 36.3% of the sales of the month, and 92% of its clicks came through affiliate links. We told the client it was a shift in what sold, not more buyers.

On the screen, July 2026
Visitors22,866up 40.21%
Buyers, orders paid591down 6.34%
Sales for each buyerSGD 47.63up 53.30%
Visit to placed order2.61%

Changes against June 2026. This page counts visitors its own way: 22,866 here and 9,806 on the traffic page are not the same measure.

Time stamps on these screens
Data Period: By Month 2026.07 (GMT+08)
July 2026.
Placed Order, Paid Order
The second and third stages of the funnel, after Visit: orders placed, then orders paid.
vs Previous Month
Against June 2026.

Month one

The creator channel we audited in June brought SGD 15.9 thousand in July.

Shopee Affiliate, July 2026

The affiliate page shows what creators brought in July, and our report shows what one creator stopping took away.

Month oneJuly 2026
Screenshot: Month one. July 2026. Affiliate Marketing Solution, Key Analytics Open the screenshot at its own size

Affiliate Marketing Solution, Key Analytics

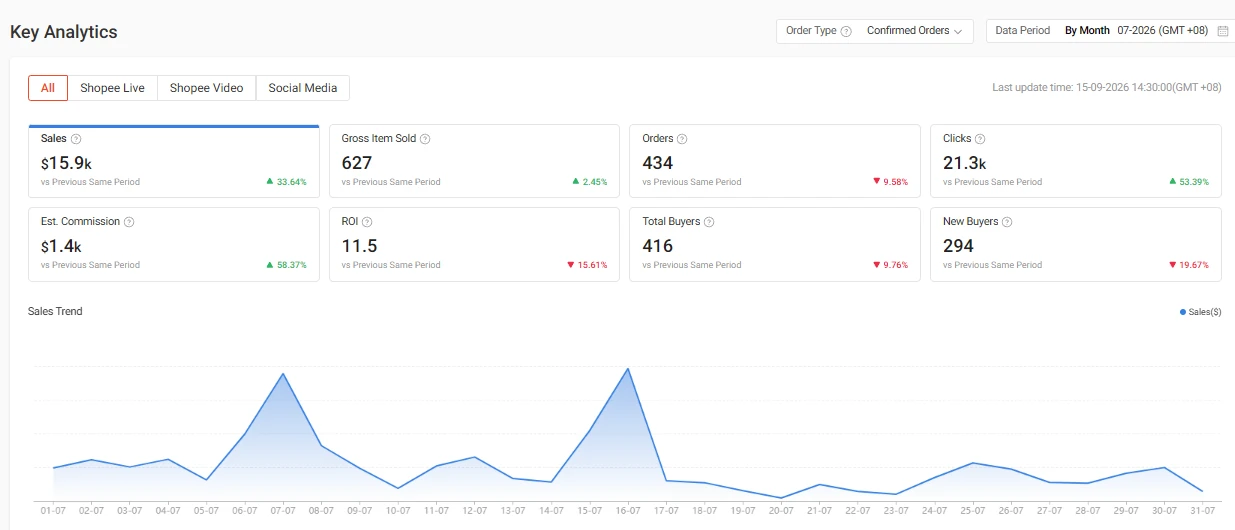
The affiliate page for July 2026: SGD 15.9 thousand of sales, up 33.64%, from 434 orders and 21.3 thousand clicks, for an estimated SGD 1.4 thousand of commission.

Our June audit had mapped this channel: about half of the store, with three affiliates carrying 53% of it. In July we tracked it creator by creator. The month one report named the creator whose pause took SGD 2,415 of sales off the former best seller, and had the brief ready to bring that creator back.

On the screen, July 2026
Affiliate salesSGD 15.9 thousandup 33.64%
Orders434down 9.58%
Clicks21.3 thousandup 53.39%
Estimated commissionSGD 1.4 thousandup 58.37%
New buyers294down 19.67%

Changes against the period before. The overview counts affiliate sales differently, so this is not comparable with its SGD 3,757.80.

Time stamps on these screens
Data Period: By Month 07-2026 (GMT +08)
July 2026.
Order Type: Confirmed Orders
Confirmed orders only.
Last update time: 15-09-2026 14:30:00
The last data refresh, 15 September 2026.
vs Previous Same Period
Against the period of the same length before it.
$15.9k, 21.3k
k is thousand.

The result

SGD 19,603.63 to SGD 28,147.28 in month one, up 43.58%.

July 2026

Two captures of one screen, a month apart, show the store selling more from fewer orders: the average order was larger.

BeforeJune 2026
Screenshot: Before. June 2026. Shopee Seller Centre, Business Insights, Overview Open the screenshot at its own size

Shopee Seller Centre, Business Insights, Overview

AfterJuly 2026
Screenshot: After. July 2026. Same screen, same filters Open the screenshot at its own size

Same screen, same filters

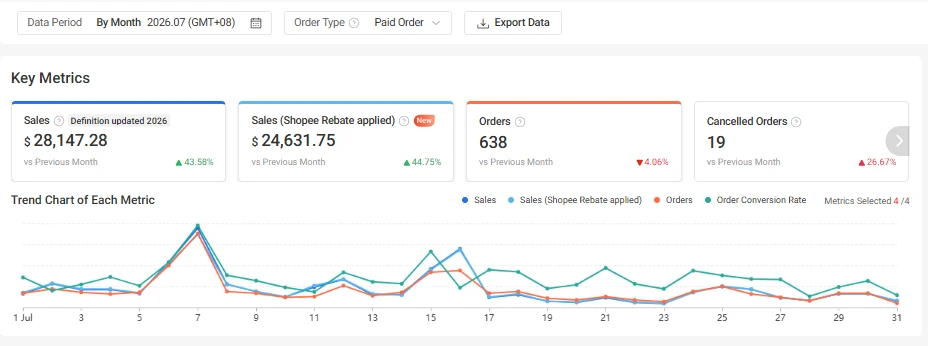
Month one, on the same screen with the same filters. July 2026 closed at SGD 28,147.28 against SGD 19,603.63 in June, up 43.58%, on 638 orders against 665. The average order went from about SGD 29 to about SGD 44.

One listing that creators pushed carried the month: its sales went from SGD 1,948 to SGD 10,298 in our report. Search, the part we rebuilt, brought 42.4% more clicks. Our reports on July set out both for the owner, product by product, with the fixes below.

Before and after
Jun 2026Jul 2026Change
Sales a monthSGD 19,603.63SGD 28,147.28up 43.58%
Orders a month665638down 4.06%
Average orderabout SGD 29about SGD 44up 49.7%

Sales and orders changes are printed on the July screen. The average order is our arithmetic.

Time stamps on these screens
Data Period: By Month 2026.06 (GMT+08)
June 2026, the month before the work.
Data Period: By Month 2026.07 (GMT+08)
July 2026, month one.
Order Type: Paid Order
Paid orders only, on both screens.
vs Previous Month
Against the month before.

What month one found

The traffic came. The leak had moved to the page.

The month one report, 31 July 2026

Clicks on products doubled in July and orders did not. The month one report set out why, product by product, with a fix for each leak.

  • 81% of carts left behind

    Counted product by product, shoppers put an item in their cart 3,886 times in July and bought 731 times. These shoppers already knew the price. They chose, then stalled.

  • The dearest option shown first

    The fastest growing listing showed the dearest of its 11 options on its search card, about five times the price of its entry size by our arithmetic.

  • A third of orders on four days

    34% of orders landed on 4 days of the month. The week after them ran at 13 orders a day against an average of 20.

  • A best seller lost its channel

    The former best seller sold SGD 3,695 less in July. Its page still converted best in the store. One creator had stopped posting.

Two of the four sit between the click and the order, where the store earns or loses the visitors it already has. One is the calendar of sale days. The fourth is the creator channel the June audit had flagged.

The report closed month one with a fix for each, and five decisions set out for the owner.

The fixes the report set out

The fastest growing listing
Show the entry size first on the search card, state the shipping fee up front, and give the price of each piece in a set.
Stalled carts
A chat broadcast to shoppers with items in their cart, with a voucher that expires soon.
The quiet week
A campaign of the store between the sale days, built on bundles and not on a price cut.
The former best seller
Bring back the creator who had stopped, and recruit two or three similar creators.

From the two versions of our month one report, both dated 31 July 2026.

What would we change in your store?

Tell us about your store in a free consultation and we will tell you where we would start. If you want the detail first, the Full Store Diagnosis costs USD 20IDR 300.000 per store and takes 3 business days from payment and data.