Skip to content

Case studiesCase 03, Snack and grocery distributor

An audit first, then the levers went back on.

RedMart sales a monthUp 23.8%

BeforeMay 2026

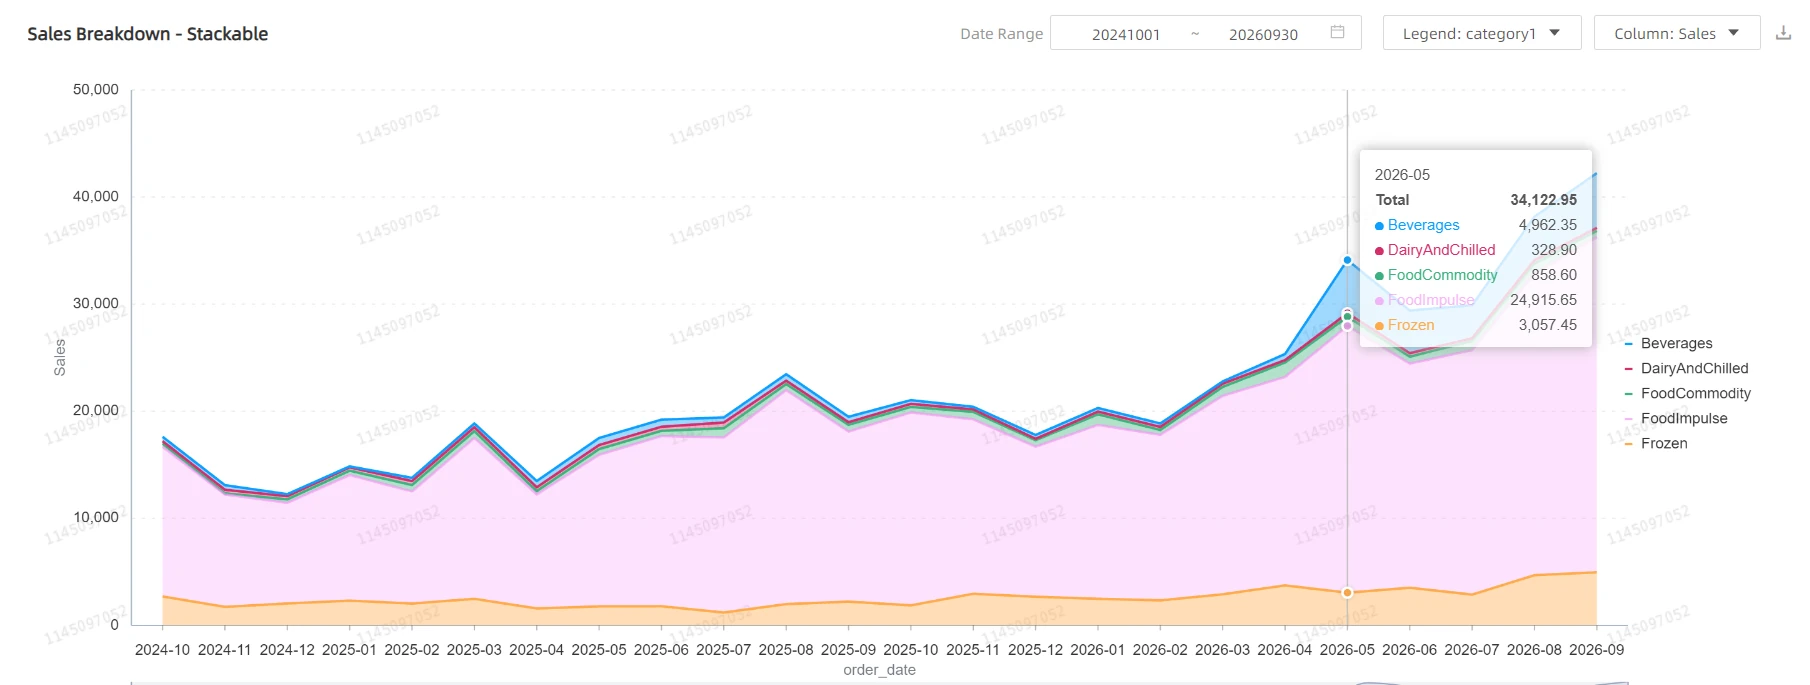
SGD34,122.95

AfterSeptember 2026

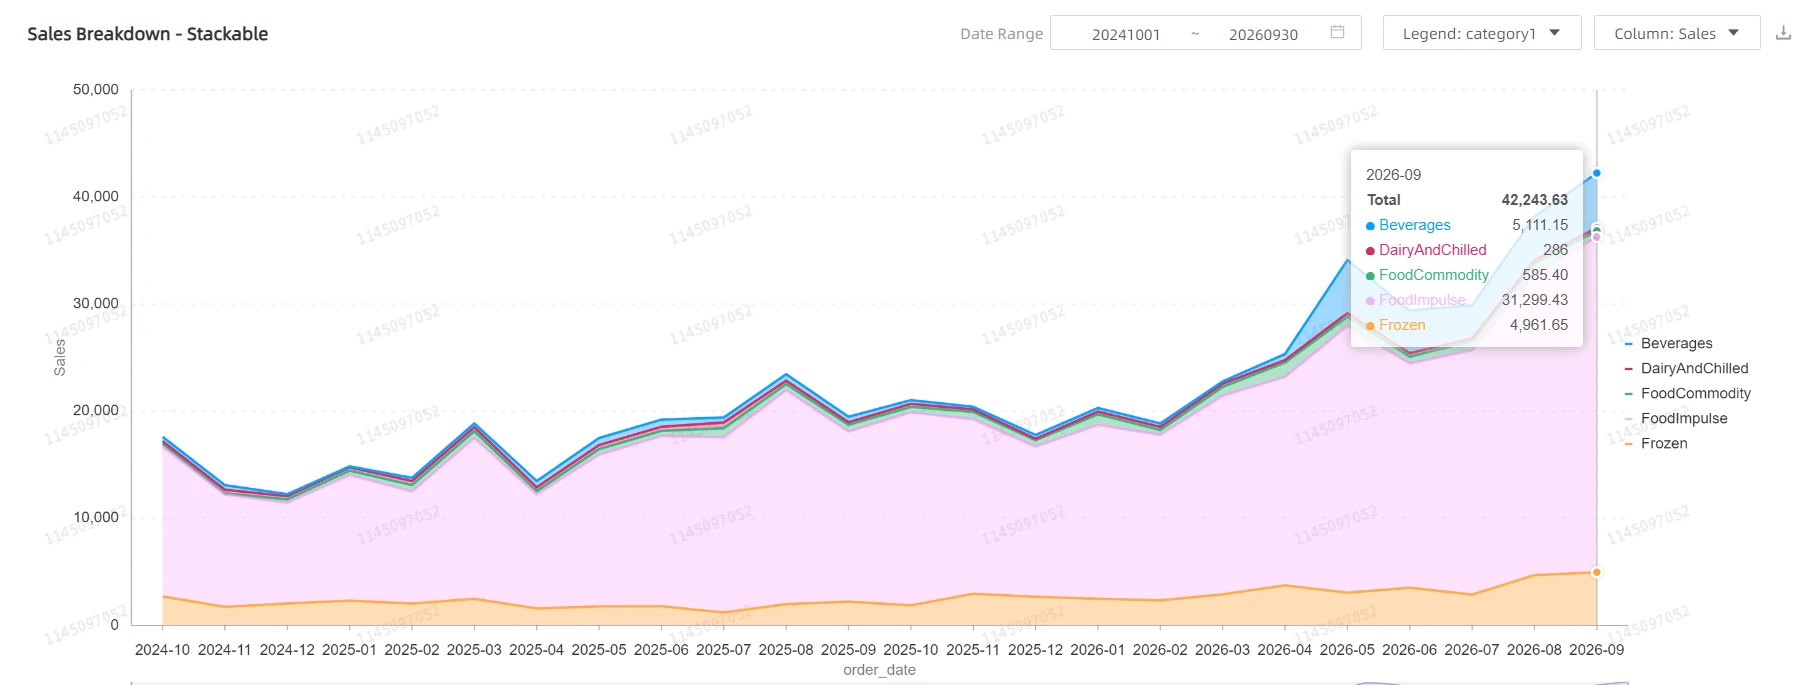
SGD42,243.63

A distributor of snacks and groceries in Singapore, selling on RedMart (Lazada) and on Shopee. We began with a read only audit in May 2026, built a profit model for the products that had sold on Shopee, and only then turned on the Shopee ads and put the RedMart promotions on a written routine. This is what the screens said before and after. The store stays unnamed. The figures are the ones on its screens.

  • Snacks and groceries
  • RedMart (Lazada) and Shopee
  • Singapore
  • May to Sep 2026
AfterSeptember 2026
Screenshot: After. September 2026. RedMart seller analytics, sales by category by month Open the screenshot at its own size

RedMart seller analytics, sales by category by month

Shopee sales a month
SGD 4,562.45
July 2026. From SGD 3,013.70 in May 2026.
Up 51.4%
Shopee ad sales
SGD 3,334.23
August 2026. No ads in the months before 22 June 2026.
From nothing
RedMart orders a month
2,694
September 2026. From 2,073 in May 2026.
Up 30.0%

From Shopee Seller Centre (paid orders), Shopee Ads and the RedMart seller analytics. The percentages are our arithmetic.

In short

  1. The problem

    In May 2026 the business sold SGD 34,122.95 on RedMart (Lazada) with its ad account below zero, two campaigns paused and 27 of 35 promotions expired. Its Shopee store sold SGD 3,013.70 with nothing switched on: no ads, no affiliates, no campaigns.

  2. What we changed

    We began with a read only audit and a profit model, to know what each product earns after fees. Only then did Shopee Ads go live, on 22 June, followed by a new RedMart campaign on 6 July, and from 22 September the RedMart promotions were put on a written daily routine.

  3. The result

    RedMart sales went from SGD 34,122.95 in May to SGD 42,243.63 in September 2026, and RedMart orders from 2,073 to 2,694. Shopee sales stepped up from SGD 3,013.70 in May to SGD 4,562.45 in July, then held above SGD 4,300 in August and September.

The problem

SGD 34,122.95 a month, and the ad account below zero.

RedMart (Lazada), May 2026

The chart shows that the business was selling in May 2026, and our audit shows what was not working for it: paused ads, expired promotions and inactive listings.

  • BeforeMay 2026: RedMart sales of SGD 34,122.95 a month, the month of our audit.
  • AfterSeptember 2026: RedMart sales of SGD 42,243.63 a month.
BeforeMay 2026
Screenshot: Before. May 2026. RedMart seller analytics, sales by category by month Open the screenshot at its own size

RedMart seller analytics, sales by category by month

RedMart is where this business sells most. In May 2026 the account sold SGD 34,122.95, most of it snacks at SGD 24,915.65, with beverages at SGD 4,962.35 and frozen at SGD 3,057.45.

Our audit of 22 May was read only: nothing was edited, saved or submitted. It found the ad account below zero with two campaigns paused, although the ads had been paying back.

In the audit, 22 May 2026

Ad account balance
Below zero, two campaigns paused
Listings
165 of 563 inactive
Promotions
27 of 35 expired, none scheduled
Low stock flags
399 products

From our read only audit of the seller dashboard. Not on the screen above.

Time stamps on these screens
2026-05
The tooltip header: May 2026.
Date Range 20241001 ~ 20260930
October 2024 to September 2026. Captured later, so months after May are visible.
FoodImpulse
A RedMart category name. In this account it holds the snack lines.
Faint diagonal number
A watermark the portal prints on its own charts. It is a number, not a name.
Shopee, May 2026

The second channel had nothing switched on: no ads, no affiliates, no campaigns.

This is where Shopee stood before any change, the month the later screens are measured against, and the audit shows where its money leaked.

BeforeMay 2026
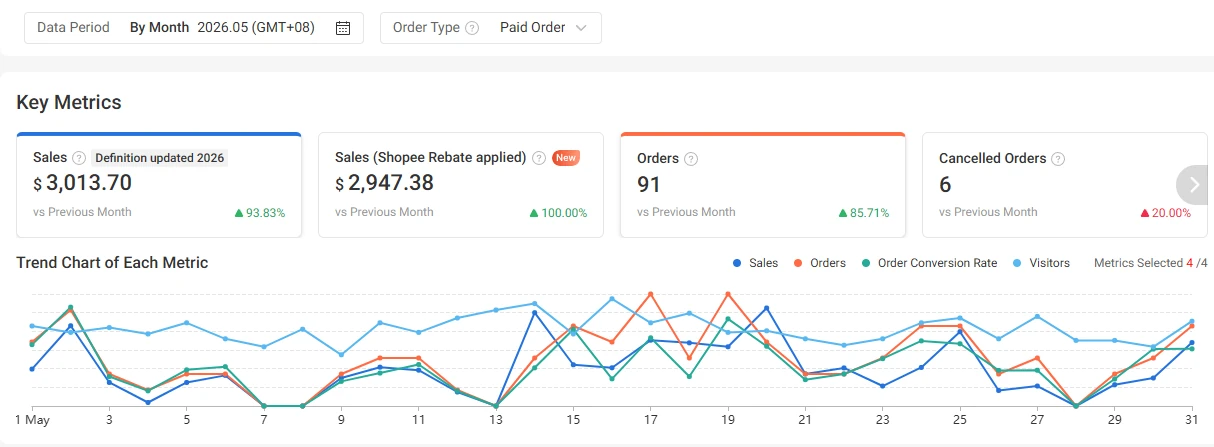
Screenshot: Before. May 2026. Shopee Seller Centre, Business Insights, Overview Open the screenshot at its own size

Shopee Seller Centre, Business Insights, Overview

The Shopee store sold SGD 3,013.70 from 91 orders in May 2026, up 93.83% on April, with every lever off: the client confirmed no ads, no affiliates, no bundle deals and no campaigns.

The audit found where the money leaked. Voucher sales had fallen from SGD 841.92 in March to SGD 21.00 in the first 18 days of May, and in those 18 days shoppers put 226 units in their carts and bought 57.

In the audit, and in the June review

Ads, affiliates, campaigns
None running
Voucher sales
SGD 841.92 in March, SGD 21.00 in 1 to 18 May
Carts, 1 to 18 May
226 units added, 57 sold
Listings with traffic and no sale
109 of 126
Lost to cancellations, 1 to 16 June
SGD 518.65

From our audit of 22 May and our profit review of 17 June. Not on the screen.

Time stamps on these screens
Data Period: By Month 2026.05 (GMT+08)
May 2026, Singapore time.
Order Type: Paid Order
Paid orders only.
vs Previous Month
Each small percentage compares May with April 2026.
Definition updated 2026
Shopee changed how it counts sales in 2026.

What we changed

Margin first, then the spend.

We did not start by adding spend. We started with what each product earns after fees, and the Shopee ads went live only after that.

  • A read only audit

    RedMart, the Lazada storefront and Shopee went through one audit on 22 May. Every edit, save and submit button was left alone.

  • Profit for each product

    A profit model on the cost file of the client, for the 36 pack sizes that had sold on Shopee, then a review of real Shopee fees and costs on 17 June.

  • Ads back on, by return

    Shopee Ads went live on 22 June. On RedMart the account was topped up within days of the audit, and a new campaign went live on 6 July.

  • Promotions on a routine

    A written routine, in force from 22 September: the top sellers are put forward for RedMart deals each working day, at a set discount, after a stock check.

The order mattered. The review of 17 June showed which range earned most, so when Shopee Ads went live one campaign went on that range, at SGD 50 a day against SGD 25 for the shop wide one, as our strategy note of early July records.

The client then showed us what our model had missed: a low priced single pack can lose money on Shopee once delivery is counted. Fees and cost of goods were in the model. Delivery was not.

What was done, and when

  1. 18 May 2026Data request sent to the client.
  2. 22 MayRead only audit of RedMart, the Lazada storefront and Shopee, through a sub account.
  3. 27 MayProfit model on the cost file of the client, for the 36 pack sizes (21 products) that had sold on Shopee.
  4. 17 JuneShopee profit review on real fees and costs. Still read only.
  5. 22 JuneShopee Ads live. By the end of June two campaigns ran, one on the best selling range and one across the shop.
  6. 6 JulyNew sponsored campaign live on RedMart, after our plan of 22 June to rebuild the campaigns.
  7. 22 SeptemberA written routine for RedMart deals takes effect, to be run each working day after the morning report.

27 May and 17 June are the dates of our files.

Shopee Ads, June to August 2026

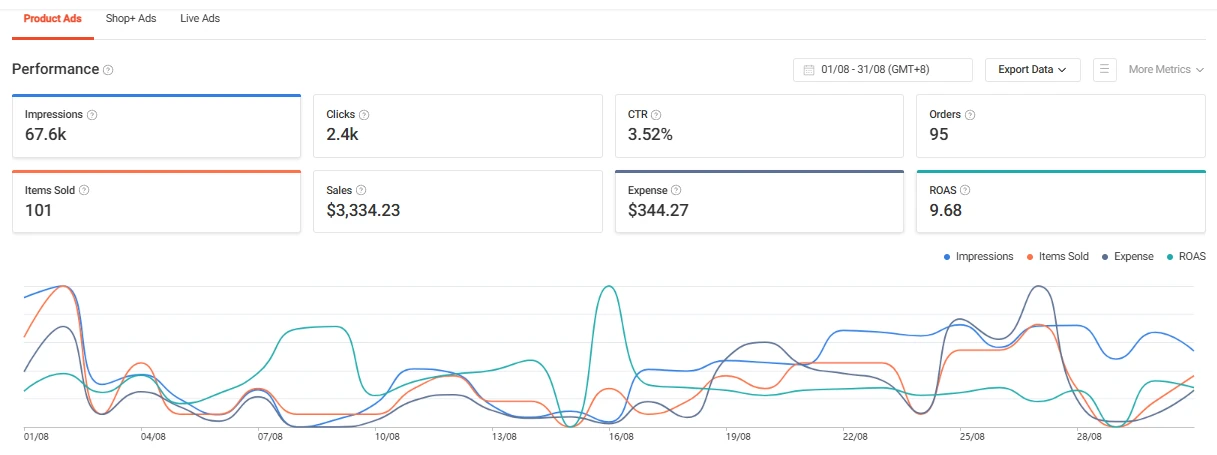
Shopee Ads: from nothing to SGD 3,334.23 of sales a month.

The ad account itself shows what the new ads sold against what they cost, first in their opening nine days and then in their second full month.

The startJune 2026
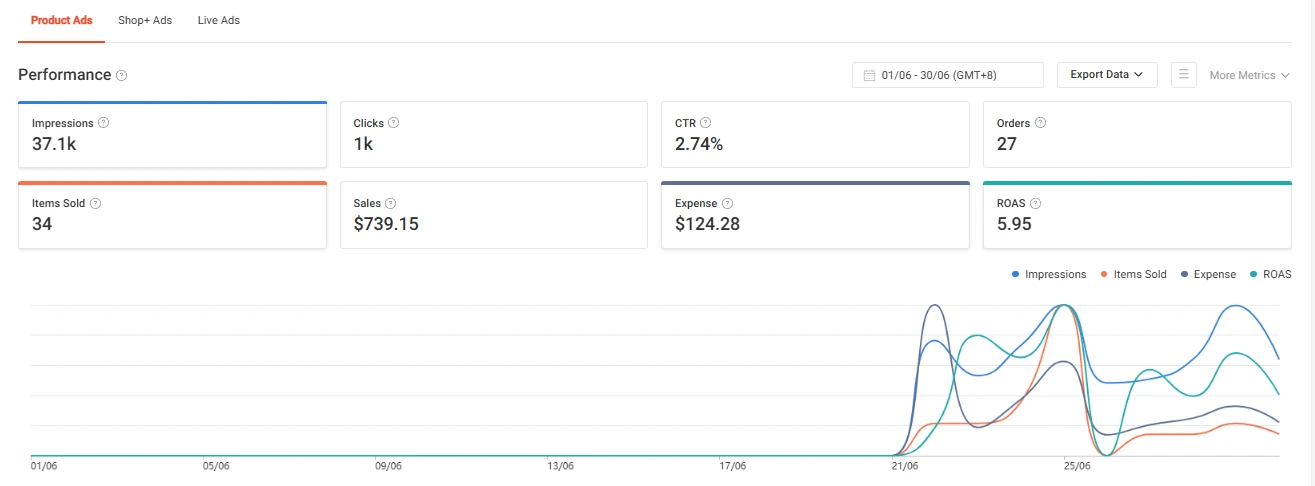
Screenshot: The start. June 2026. Shopee Ads, Product Ads, Performance Open the screenshot at its own size

Shopee Ads, Product Ads, Performance

AfterAugust 2026
Screenshot: After. August 2026. Same screen Open the screenshot at its own size

Same screen

In the months before 22 June the store was not advertising on Shopee. The June capture holds the first nine days: SGD 739.15 of sales on SGD 124.28 of spend, from 27 orders.

August is the second full month: SGD 3,334.23 of sales on SGD 344.27 of spend, from 95 orders. The click rate went from 2.74% to 3.52%.

On the two screens
Jun 2026Aug 2026
Ad salesSGD 739.15SGD 3,334.23
Ad spendSGD 124.28SGD 344.27
Orders2795
Click rate2.74%3.52%

June holds nine days of ads, 22 to 30 June.

Time stamps on these screens
01/06 - 30/06 (GMT+8)
June. Shopee Ads prints no year. It is 2026: the store ran no Shopee ads from February until 22 June 2026.
01/08 - 31/08 (GMT+8)
August 2026.
Flat line until 21/06
The chart sits at zero until 21 June and rises on 22 June, the day the ads went live.
37.1k, 67.6k
On the ads page k is thousand.

Shopee, May to July 2026

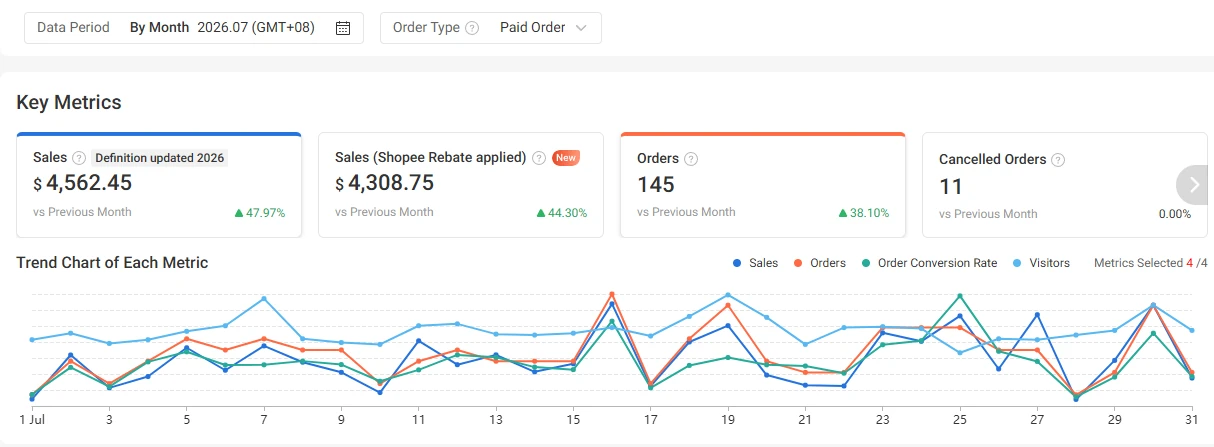
Shopee sales up 51.4% in the first full month with ads.

This is the whole store, not only the ad account: sales and orders both rose, against a month that was itself strong.

BeforeMay 2026
Screenshot: Before. May 2026. Shopee Seller Centre, Business Insights, Overview Open the screenshot at its own size

Shopee Seller Centre, Business Insights, Overview

AfterJuly 2026
Screenshot: After. July 2026. Same screen Open the screenshot at its own size

Same screen

May 2026, before any change: SGD 3,013.70 from 91 orders. July 2026, the first full month with ads: SGD 4,562.45 from 145 orders. By our arithmetic that is 51.4% more sales and 59.3% more orders.

May was itself a strong month, up 93.83% on April, so the base was not a low one.

Before and after
May 2026Jul 2026Change
Sales a monthSGD 3,013.70SGD 4,562.45up 51.4%
Orders a month91145up 59.3%
Average orderabout SGD 33about SGD 31down 5.0%

The change column and the average order are our arithmetic.

Time stamps on these screens
Data Period: By Month 2026.05 (GMT+08), 2026.07 (GMT+08)
May and July 2026, Singapore time.
Order Type: Paid Order
Paid orders only, on both screens.
vs Previous Month
Against the month before.

Shopee, August and September 2026

It held: SGD 4,417.73 in August, SGD 4,378.60 in September.

Two more months on the same screen show that the July step stayed, and that cancelled orders, the leak our June review named, fell month after month.

Month twoAugust 2026
Screenshot: Month two. August 2026. Same screen Open the screenshot at its own size

Same screen

Month threeSeptember 2026
Screenshot: Month three. September 2026. Same screen Open the screenshot at its own size

Same screen

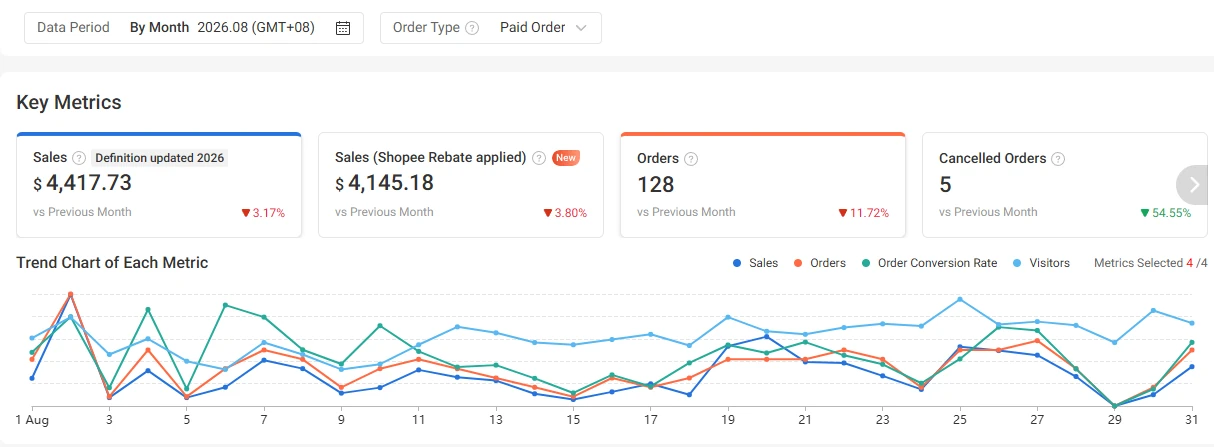
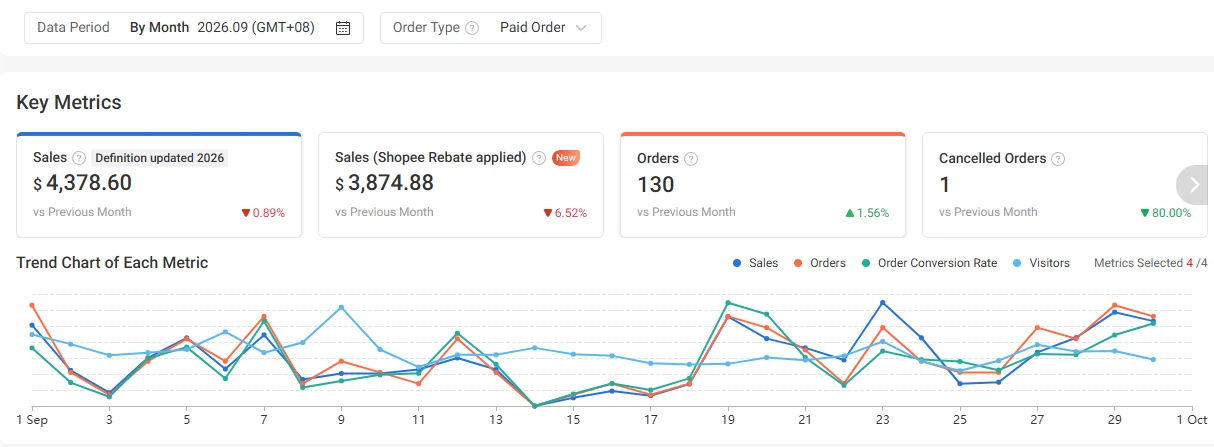
The two months after July, on the same screen. August closed at SGD 4,417.73 from 128 orders and September at SGD 4,378.60 from 130 orders: a step up in July, then level.

Cancelled orders are the other thing to read here. Our June review named them as the leak. They stood at 11 in July, on the screen in the section before, then 5 in August and 1 in September.

On the two screens
Aug 2026Sep 2026
SalesSGD 4,417.73down 3.17%SGD 4,378.60down 0.89%
Orders128down 11.72%130up 1.56%
Cancelled orders5down 54.55%1down 80.00%

Changes against the month before, as Shopee shows them.

Time stamps on these screens
Data Period: By Month 2026.08 (GMT+08), 2026.09 (GMT+08)
August and September 2026.
Order Type: Paid Order
Paid orders only.
1 Sep to 1 Oct
The chart axis. On a 30 day month the last tick is the first day of the next month.

Where Shopee sales came from, July 2026

The ads touched 74% of July sales, in their first full month.

This screen breaks the July sales down by where they came from, so the part the ads played can be read straight from Shopee.

AfterJuly 2026
Screenshot: After. July 2026. Business Insights, Overview, Traffic Sources Open the screenshot at its own size

Business Insights, Overview, Traffic Sources

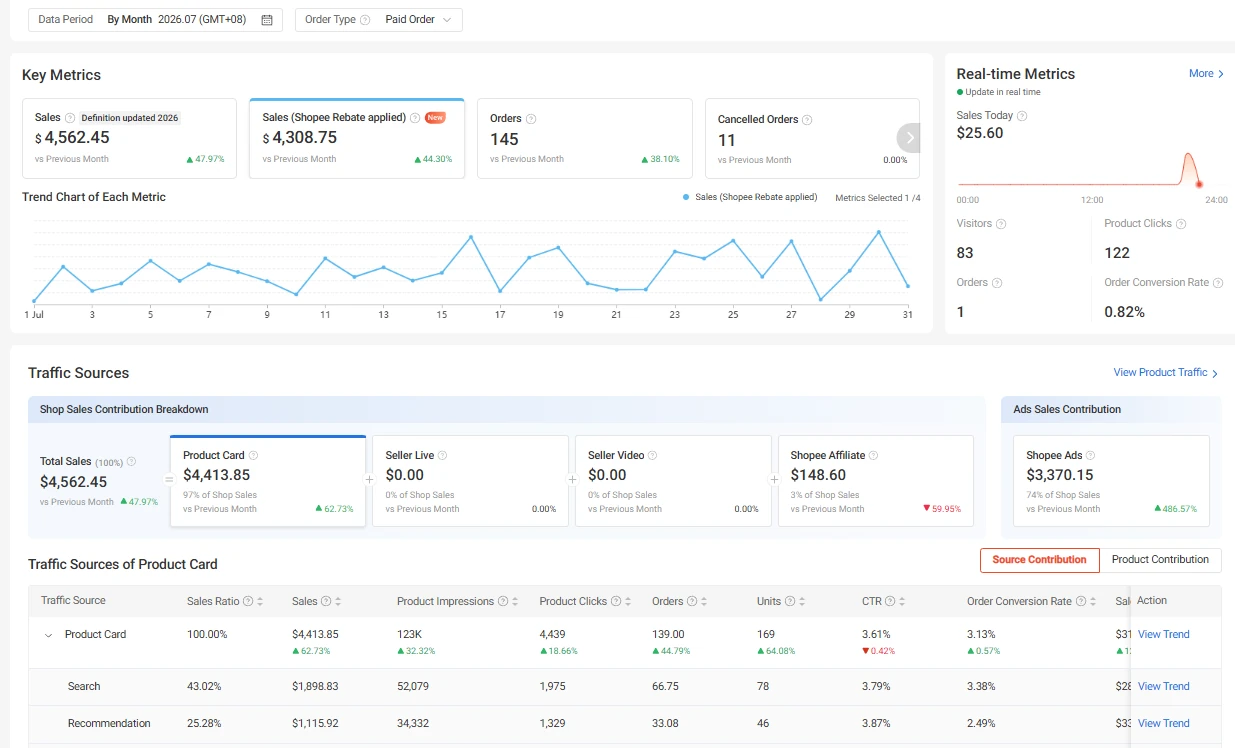
The overview breaks July down by channel. Of SGD 4,562.45, product cards brought SGD 4,413.85, which is 97%. Inside product card sales, search was the largest source at 43.02%, SGD 1,898.83.

The ads card reads SGD 3,370.15, 74% of sales, in the first full month with ads. It is a separate count that overlaps the channel split, so the two are read side by side and not added together. Over the same month the store total rose 47.97% on June.

On the screen, July 2026
Product cardsSGD 4,413.85up 62.73%
Search, share of product card sales43.02%
Recommendations25.28%
Shopee AffiliateSGD 148.60down 59.95%
Sales touched by adsSGD 3,370.15up 486.57%

Changes against June 2026, as Shopee shows them.

Time stamps on these screens
Data Period: By Month 2026.07 (GMT+08)
July 2026, paid orders.
Real-time Metrics
The side panel shows the day of capture, not July: SGD 25.60 that day.
vs Previous Month
Against June 2026, when ads ran for nine days. Hence the 486.57% on the ads card.

RedMart sponsored ads, May to August 2026

RedMart ads: less spend, and 435 orders against 180.

This is the same RedMart ad report under the old setup and under the campaign we rebuilt, and it shows what each got for its spend.

BeforeAbout May 2026
Screenshot: Before. About May 2026. RedMart Sponsored Solutions, campaign report Open the screenshot at its own size

RedMart Sponsored Solutions, campaign report

AfterAugust 2026
Screenshot: After. August 2026. Same report Open the screenshot at its own size

Same report

The campaignLive since 6 July 2026
Screenshot: The campaign. Live since 6 July 2026. The campaign list, August 2026 Open the screenshot at its own size

The campaign list, August 2026

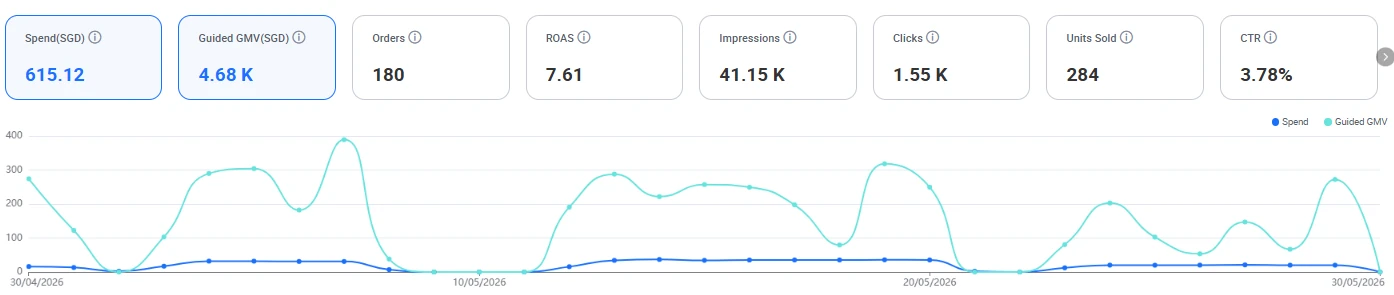
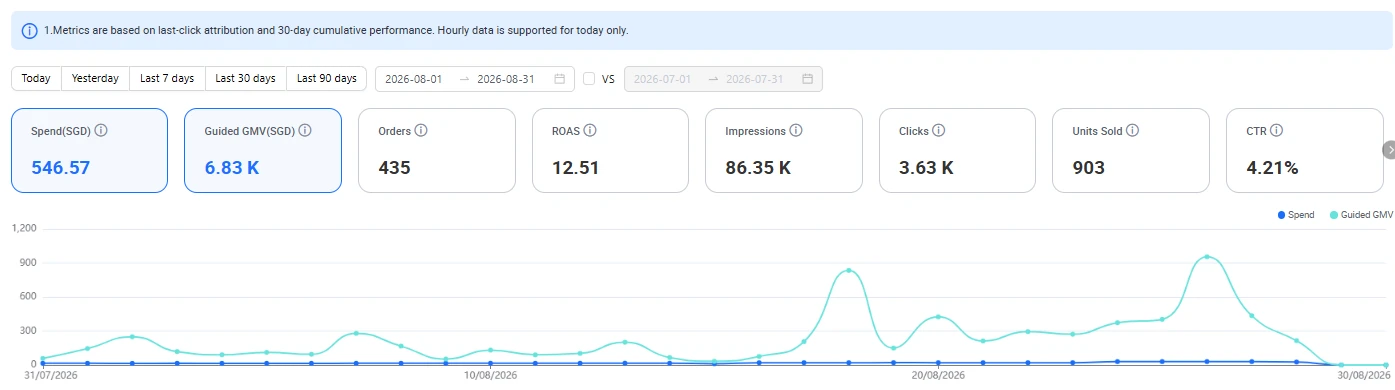
At the audit the RedMart ad account sat below zero with its campaigns paused. It was topped up, and the ads were spending again within days. On 6 July a new campaign went live. In August it ran on a budget of SGD 30 and a maximum bid of SGD 0.20, as the campaign row prints.

In about the month of May the old setup spent SGD 615.12 for 180 orders. In August the new campaign spent SGD 546.57 for 435 orders, on more than twice the clicks.

On the screens
About MayAugust
SpendSGD 615.12SGD 546.57
Sales guided by adsSGD 4.68 thousandSGD 6.83 thousand
Orders180435
Clicks1.55 thousand3.63 thousand

The campaign row prints 436 orders and SGD 6,835.77.

Time stamps on these screens
30/04/2026 to 30/05/2026
The first capture prints no date range. Its chart axis covers about the month of May.
2026-08-01 to 2026-08-31
The second capture: August 2026.
06/07/2026 ~ No End Date
The campaign started on 6 July 2026.
4.68 K, 6.83 K
K is thousand.

RedMart orders, May to September 2026

RedMart orders a month went from 2,073 to 2,694.

This chart counts orders and customers instead of dollars: both rose between May and September, after a dip in June and July.

BeforeMay 2026
Screenshot: Before. May 2026. RedMart seller analytics, orders and customers by month Open the screenshot at its own size

RedMart seller analytics, orders and customers by month

AfterSeptember 2026
Screenshot: After. September 2026. Same chart, pointer on September Open the screenshot at its own size

Same chart, pointer on September

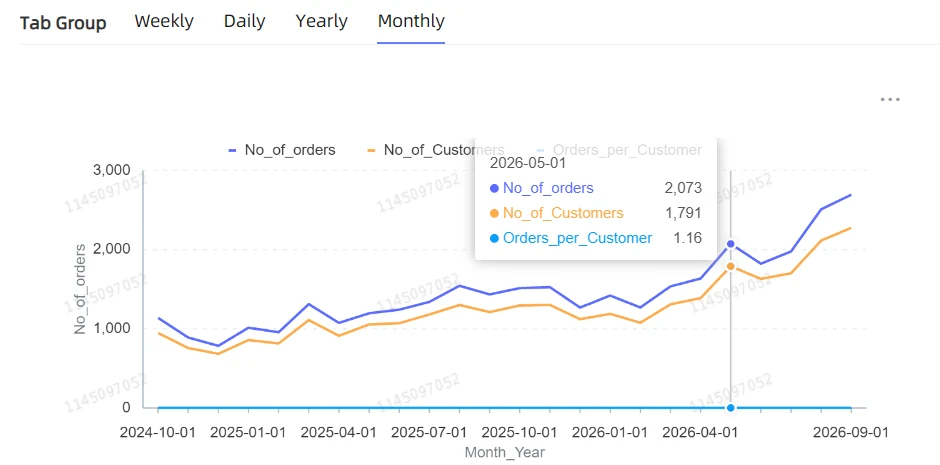
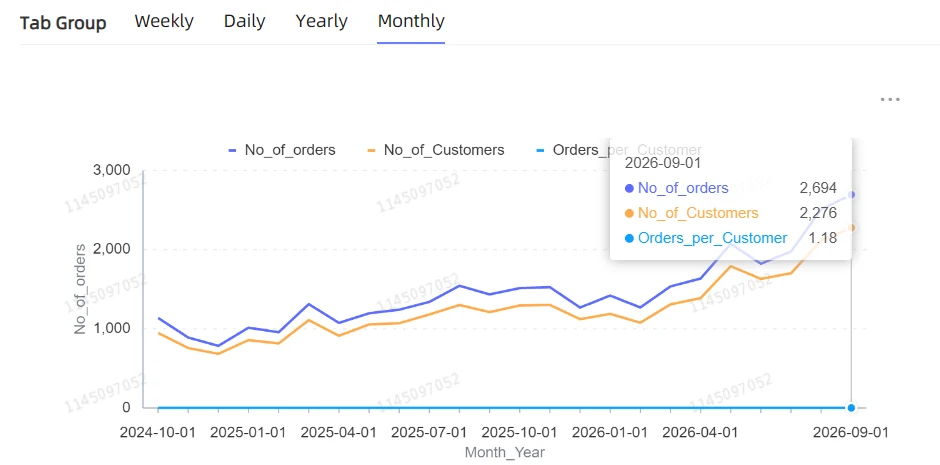
The same chart with the pointer on two different months. In May 2026 the account took 2,073 orders from 1,791 customers. In September it took 2,694 orders from 2,276 customers.

By our arithmetic that is 30.0% more orders and 27.1% more customers. The line dips in June and July before it climbs, so the rise was not a straight one.

Before and after
May 2026Sep 2026Change
Orders2,0732,694up 30.0%
Customers1,7912,276up 27.1%
Orders for each customer1.161.18about level

The change column is our arithmetic from the two tooltips.

Time stamps on these screens
2026-05-01, 2026-09-01
The tooltip header: May 2026, and September 2026.
2024-10-01 to 2026-09-01
The chart axis, one point for each month.
Monthly
The tab in use.
Faint diagonal number
A watermark the portal prints on its own charts. It is a number, not a name.
RedMart customers, May to September 2026

Customers who had bought before: 992 to 1,455 a month.

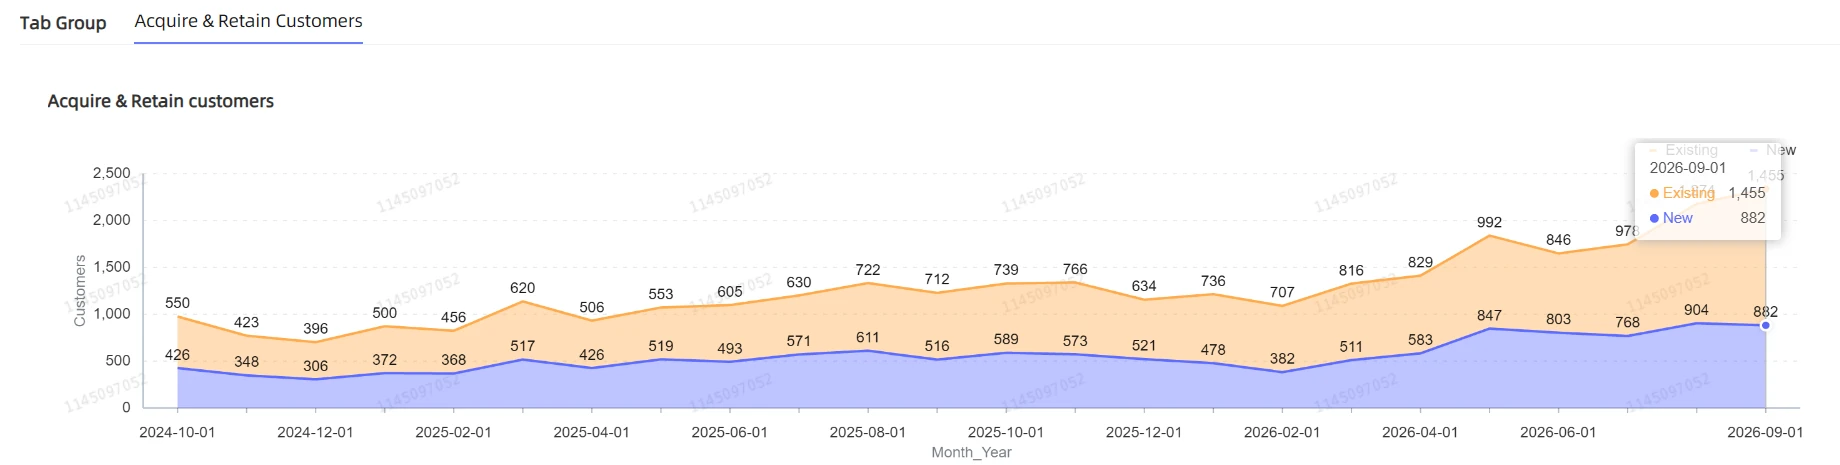
This chart shows where the extra customers came from: mostly people who had bought before, with first time customers about level.

AfterSeptember 2026
Screenshot: After. September 2026. RedMart seller analytics, new and existing customers by month Open the screenshot at its own size

RedMart seller analytics, new and existing customers by month

This chart splits each month into customers buying for the first time and customers who had bought before. Every month carries its own printed label.

May 2026 reads 847 new and 992 existing. September reads 882 new and 1,455 existing. New customers were about level. Existing customers rose by 46.7%, which points at repeat buying more than at new reach.

On the chart
May 2026Sep 2026Change
New customers847882up 4.1%
Existing customers9921,455up 46.7%

Both months are printed on this one chart. The change column is our arithmetic. This chart counts customers a little differently from the chart in the section before, so new plus existing comes to slightly more than the customer count there.

Time stamps on these screens
2026-09-01
The tooltip header: September 2026.
2024-10-01 to 2026-09-01
The chart axis. Each point carries its own label.
Faint diagonal number
A watermark the portal prints on its own charts. It is a number, not a name.
The result

RedMart at SGD 42,243.63 a month, Shopee above SGD 4,300.

September 2026

This is the same chart as in the trouble above, with the pointer moved from May to September 2026: both channels ended above where they began.

AfterSeptember 2026
Screenshot: After. September 2026. RedMart seller analytics, sales by category by month Open the screenshot at its own size

RedMart seller analytics, sales by category by month

September 2026 on the same chart as the first screen of this case: SGD 42,243.63, against SGD 34,122.95 in May. Snacks carried it, SGD 31,299.43 against SGD 24,915.65.

It was not a straight line. June and July sat below May, before August and September became the two highest months on the chart. On Shopee the step came in July and held.

Before and after
May 2026Sep 2026Change
RedMart salesSGD 34,122.95SGD 42,243.63up 23.8%
RedMart orders2,0732,694up 30.0%
Shopee salesSGD 3,013.70SGD 4,378.60up 45.3%
Shopee orders91130up 42.9%

May figures and the Shopee rows are printed in the earlier sections of this case. The change column is our arithmetic.

Time stamps on these screens
2026-09
The tooltip header: September 2026.
Date Range 20241001 ~ 20260930
October 2024 to September 2026.
FoodImpulse
A RedMart category name. In this account it holds the snack lines.
Faint diagonal number
A watermark the portal prints on its own charts. It is a number, not a name.
Since then

Promotions on a routine: stock first, one deal at a time.

RedMart promotions, from 22 September 2026

The audit found 27 of 35 RedMart promotions expired and none scheduled. The answer was not one big campaign. It was a daily routine that a team member can run without guessing.

  • The top 20, and one exception

    The products put forward are the best sellers of August that still earn at least 5% after the discount and the ads, with one more allowed for campaigns. Two lines that earn almost nothing are never put forward.

  • Stock is counted first

    Together, the deals of one product may lock at most a quarter of its stock, and never the last seven days of sales. A workbook does the sum before anything is submitted.

  • One fixed discount

    The deal price is the normal price less 7%, worked out in advance and pasted in. If the platform asks for a lower price, the rule is to stop and ask.

  • Every working day

    After the morning report, for twenty to thirty minutes. Each product sits in one promotion at a time, and the results are checked every Friday.

A promotion calendar that depends on one person remembering it stops the week that person is busy. Written down, with the prices worked out and the stock rule built into a sheet, it is set to run every working day.

The routine took effect on 22 September, in a week planned from Monday 21 September. It is our answer to the expired promotions the audit found.

The schedule for the first week, 21 to 25 September 2026

Monday
Stock counted for all 20 products. Five put forward for the flash sale of 26 and 27 September.
Tuesday
Ten more put forward for the flash sales of 28 to 30 September.
Wednesday
Five put forward for the weekly add on deals from 28 September.
Thursday and Friday
All 20 that are not on low stock put forward for the 10.10 campaign and the days after it. Results checked and logged.

The schedule as set out in our planning document for that week.

What would we change in your store?

Tell us about your store in a free consultation and we will tell you where we would start. If you want the detail first, the Full Store Diagnosis costs USD 20IDR 300.000 per store and takes 3 business days from payment and data.